

Table
I.
Driving Data of Car-Following
| Time | Collected data | |||
| t1 | v1 | v2 | a | c |
| t2 | v1 | v2 | - | c |
 Volume 7
Issue 4
Volume 7
Issue 4
IEEE/CAA Journal of Automatica Sinica
| Citation: | Jing Huang, Yimin Chen, Xiaoyan Peng, Lin Hu and Dongpu Cao, "Study on the Driving Style Adaptive Vehicle Longitudinal Control Strategy," IEEE/CAA J. Autom. Sinica, vol. 7, no. 4, pp. 1107-1115, July 2020. doi: 10.1109/JAS.2020.1003261

|
THE adaptive cruise control (ACC) system and the collision avoidance (CA) system are used extensively in vehicular active safety fields. As a key component of advanced driver assistance systems, the ACC and CA systems are designed to ease driving fatigue and improve driving safety, but most current advanced driver assistance systems only focus on the vehicular safety requirements and do not consider the adaptability of drivers of different styles [1]–[3]. Extended use of ACC may influence a driver’s behavior in the long term, which could cause unintended safety consequences [4]–[6], and the traditional single design may no longer be able to adapt to the future of driver’s personalized demand. So, it is necessary to consider the driver’s driving style when designing the ACC system to reduce the influence of the system on the driver’s behavior and improve the safety of the system. Besides, the ACC system and CA system are seldom integrated in their designs, and they often work independently of each other. Therefore, in an emergency braking situation, drivers and occupants would suffer a serious impact.
In terms of the driver’s adaptability, the environmental factors and the driver’s characteristics should be taken into account [7], and many researchers have used actual driving data from the actual traffic conditions to improve the personalized control of ACC and CA systems [8]–[10]. The self-learning algorithms are often used to identify driver characteristics from the data in the manual operation phase [11], such as the recursive least-square method with the forgetting factor [12], and then the obtained driver characteristic parameters are used in the vehicle automatic control strategy. Xiong et al. examined quantitatively drivers’ adaptations using a conceptual model of adaptive behaviors and logistic regression techniques [13]. Moon et al. obtained drivers’ risk perceptions based on actual driving data, and the control strategy of the ACC/CA system was designed, including three working modes: safe, warning, and dangerous; each mode adopted different control methods to ensure the safety and comfort of drivers in the full speed range [14]. In [15], [16], the change of signal light is considered to control the driving of vehicles at intersections. However, the adaptability to drivers of different styles was not considered in Moon’s work, and there was a large acceleration change in the combination of the ACC system and CA system, which induced a more serious impact on the driver.
In addition to driver adaptability, studies are trying to intensify the reliability of the ACC and CA systems to reduce the failure ratio while improving the functions. To make the ACC system work well at both highway and city street speeds, Zhao et al. developed an adaptive supervisory adaptive dynamic programming algorithm [17]. The model predictive control has also been widely used in the ACC system to predict velocity and distance in the desired trajectory [18]–[20]. Based on the V2V communication technology to share information among neighboring vehicles, some researchers have developed cooperative adaptive cruise control technology [21]–[23] and cooperative collision avoidance technology [24], [25]. It is common to consider the tire-road friction in the vehicle collision safety distance calculation [26], which would increase the accuracy of the algorithm. Furthermore, increasing attention has been paid to combining the ACC and CA systems [27]–[29]. Ba et al. integrated the functions of the ACC and CA systems into a single control system, which reduced vehicle impact deceleration but worsened driving safety in an emergency condition [30].
To reduce the risk of vehicle collisions and improve driver adaptability, this paper presents a fusion control strategy of the ACC and CA systems with consideration of driving style. The driving behavior characteristics of different style drivers are identified through a questionnaire survey and driving simulator experiments. Based on the driving styles, a driver-adaptive ACC/CA fusion control strategy was designed. The combined design of the ACC system and the CA system enables the vehicle to achieve a full-speed safe driving range.
The rest of this paper is structured as follows. Section II introduces the approaches of identifying the driving styles. Section III details the design procedures of the driving style adaptive longitudinal control. The validation of the proposed strategy is provided in Section IV, followed by the conclusions in Section V.
The driving simulator experiments aimed to obtain the actual driving behavioural data of different styles of drivers under car-following and emergency braking conditions. The volunteers were recruited among skilled drivers. Their driving characteristics were identified through a questionnaire survey, which was designed based on the driver behaviour questionnaire (DBQ) [31] and the multi-dimensional driving style inventory (MDSI) [32] and were mainly modified for the longitudinal driving behavioural analysis [33], [34]. A total of 212 volunteer drivers participated in the questionnaire survey, including 145 male and 67 female drivers. K-means cluster analysis was used to classify the drivers into three driving styles- the cautious style, ordinary style, and aggressive style, the proportion of cautious, ordinary and aggressive drivers was approximately 1: 3: 1, and there were a few more cautious drivers than aggressive drivers. Based on this proportion, 8 cautious, 16 ordinary and 6 aggressive drivers were selected to further finish the driving simulator experiments, these 30 volunteers are from 23 to 30 years old, with an average age of 25 years. The driving ages of volunteers are from 2 to 6 years, and the average driving age is 3.4 years. Their corresponding driving behavioural data were collected, which served as the template data after the cluster analysis for the online identification of driving type.
The driving simulator used in this study was FORUM 8, and the virtual driving experiment system was built by the UC-win/Road software, including the scene design, functional requirement analysis and interaction scheme. The scene design included static scenes and dynamic scenes. The static scene mainly contained the road design, the configuration of trees, buildings, traffic signs, and so on. The dynamic scene was mainly composed of the setting of the interference vehicles in the simulated scene, as well as the traffic flow on the road [10], [14].
To get the natural driving data of different styles of drivers under the car-flowing and emergency collision avoidance conditions, the whole test road was designed as a 3000 m long four-lane straight road. An SUV moved preceding of the simulated target vehicle, with an initial speed of 8.3 m/s (30 km/h), and its velocity changed from time to time, as vehicles usually drive on urban streets. The detailed driving conditions of the SUV were set as follows: 500 m, with an even speed 8.3 m/s (30 km/h)—130 m of acceleration, to 16.7 m/s (60 km/h)—1000 m, with an even speed 16.7 m/s (60 km/h)—160 m of deceleration, to 5.6 m/s (20 km/h)—300 m, with an even speed 5.6 m/s (20 km/h)—260 m of acceleration, to 16.7 m/s (60 km/h)—500 m, with an even speed 16.7 m/s (60 km/h). This stage was designed to collect the car-following driving data. Then, the preceding SUV began emergency braking, and its speed decelerated to zero within 17 m. This stage was designed to collect the driving data of emergency collision avoidance.
Each volunteer repeated the simulator experiments three times; then, the resulting driving data were collected under the car-following and emergency collision avoidance conditions, as shown in Tables I and II, respectively.
| Time | Collected data | |||
| t1 | v1 | v2 | a | c |
| t2 | v1 | v2 | - | c |
 DownLoad:
CSV
DownLoad:
CSV
| Time | Collected data | |||
| t1 | v1 | v2 | ac | c |
| t2 | amax | |||
DownLoad:
CSV
Here, t1 refers to any time during the car-following driving period, t2 is the moment when the target vehicle started to brake, v1 and a are the velocity and acceleration of the target vehicle, respectively, v2 is the velocity of the preceding vehicle, and c is the actual distance between the two vehicles.
Table II shows the data collected during the emergency collision avoidance driving condition. t1 and t2 are the moment when the target vehicle began to brake and the moment when it reached the maximum braking deceleration, respectively, ac is the deceleration at the moment when the target vehicle began to brake, amax is the maximum braking deceleration of the target vehicle, and c is the actual distance between the two vehicles.
The factors that influence driver behaviours under the car-following condition mainly depend on the different psychological endurances of different style drivers with respect to the relative speed and relative distance between the target vehicle and the preceding vehicle. We identified the driver behavioural characteristics of different styles of drivers based on the driving data, which were collected during the driving simulator experiments. The data were used as the template data and the threshold value during the online driver style identification.
Based on the collected driving data a, c, v1, and v2 under the car-following condition, as listed in Table I, the coefficients k1 and k2 of the transfer function that represent the driving behavioural characteristics of different styles of drivers are calculated according to
| a=−KX=−k1(cd−c)−k2(v2−v1) | (1) |
where cd is the desired distance between the two vehicles, and it is obtained by
| cd=v2th+d0 | (2) |
where th is the time headway. In this study, th = 1.5 s, and d0 is the zero-speed distance between the target vehicle and the preceding vehicle.
The data collected during the emergency collision avoidance driving condition were mainly used to calculate the increase rate p of different style driver braking forces in emergencies, and it was calculated according to
| p=ac−amaxt2−t1. | (3) |
Table III lists the calculated driving behavioural characteristics of different styles of drivers.
| Characteristics | ACC | CA | ||
| k1 | k2 | amax | p | |
| Aggressive | 0.0354 | –0.8341 | –7.2000 | 4.5000 |
| Ordinary | 0.0775 | –0.5049 | –6.8000 | 3.1500 |
| Cautious | 0.0913 | –0.4369 | –6.1800 | 2.3500 |
DownLoad:
CSV
It can be seen from Table III that the coefficient k2 of aggressive drivers is highest. This coefficient is related to the velocity variation in ACC. A higher k2 implies a better control ability over the vehicle speed, and the driver intends to attain the same speed as the preceding vehicle. While, the coefficient k1 is a coefficient of the clearance between two vehicles. The cautious drivers have the highest k1, which means the driver is more inclined to maintain the desired safety distance. In the case of emergency collision avoidance, the aggressive drivers tend to have a larger braking deceleration, and braking deceleration declines fast. Therefore, it can be concluded that the aggressive drivers are more inclined to make a rapid response and to have a higher braking deceleration. The p value reflects the braking speed. The coefficient p of aggressive drivers is highest, thus implying that the aggressive drivers prefer to make the highest deceleration.
Based on the data collection and analysis from the driving simulator experiments, the driver behavioural characteristics of the three types of drivers were quantified as the coefficients k1, k2, and p, which were further used in the driver-adaptive control strategy design.
Fig. 1 illustrates the sketch of the driver-adaptive longitudinal control strategy designed in this study. First, the sensor module collects the driving data, and the decision module identifies the driving style online using the fuzzy recognition according to the driving data; then, the upper-level controller will choose the suitable control parameters based on the identified driving style to calculate the desired vehicle acceleration. The lower-level controller will use the fuzzy PID control principle [35], [36] to convert the acceleration into the braking pressure or the engine throttle opening to achieve driving style adaptive control.
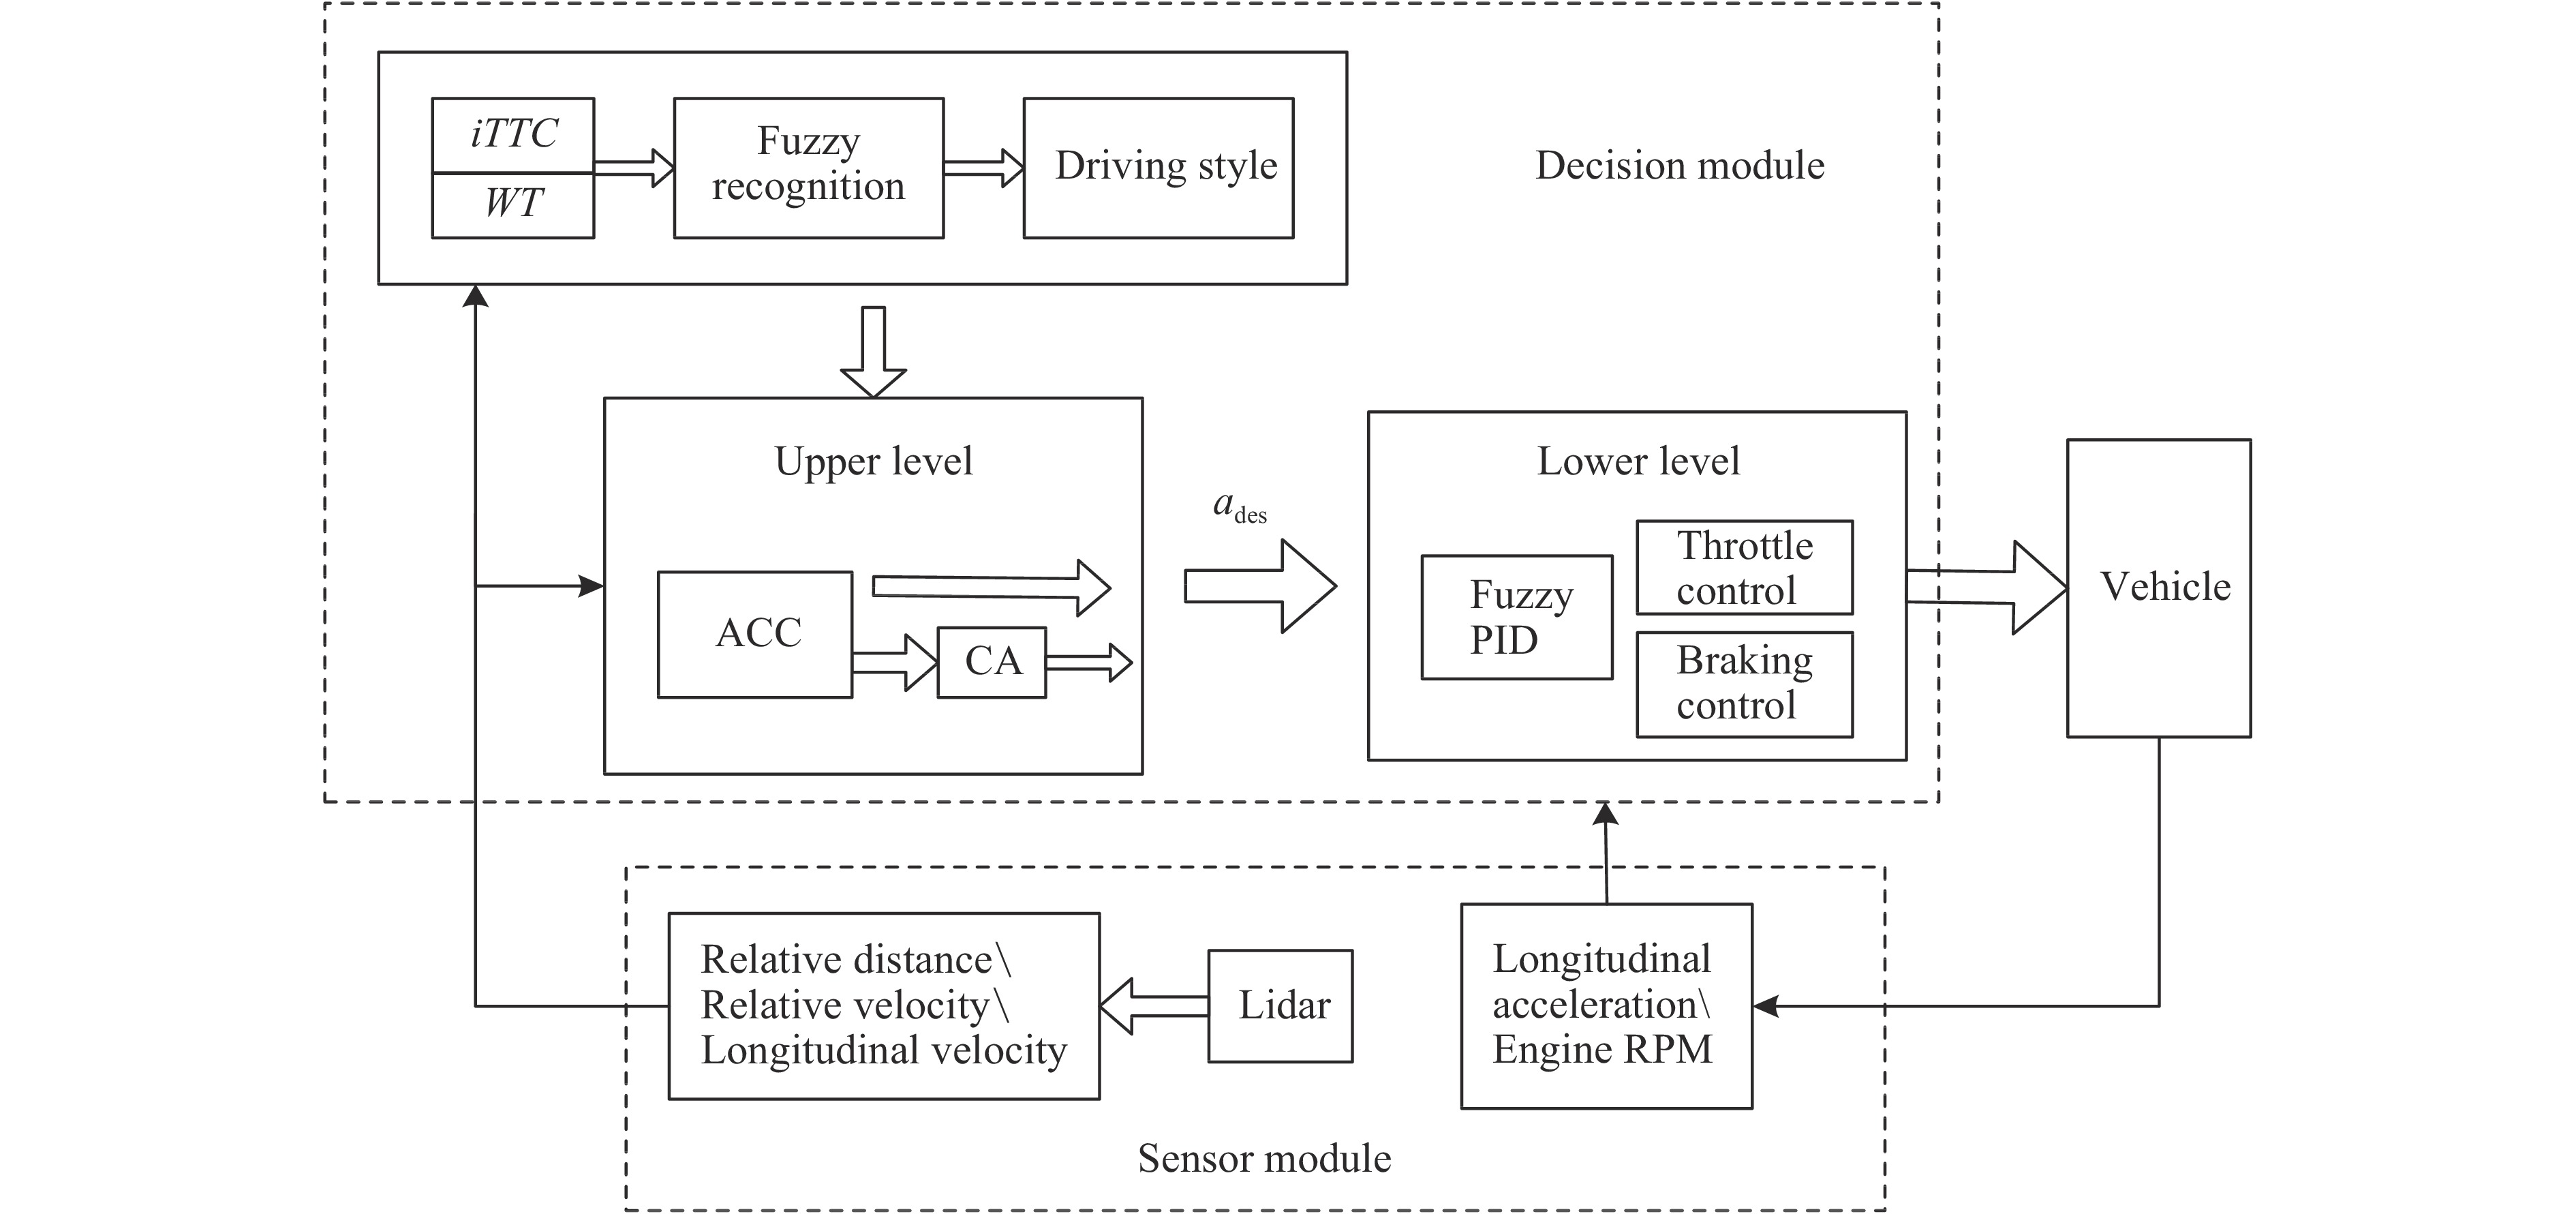
In this study, the warning threshold WT and iTTC were used as the driving style recognition indicators, which also determine the switching moment between the CA and ACC systems. WT and iTTC were calculated according to
| WT=c−dbdw−db | (4) |
| iTTC=v1−v2c | (5) |
where c is the distance between the target vehicle and the preceding vehicle, v1 and v2 are the velocities of the target vehicle and the preceding vehicle, respectively, db is the braking-critical distance, dw is the warning-critical distance, and db and dw can be calculated according to (6) and (7), respectively.
| db=vrelTs+12[v21amax−v22a2]+d0 | (6) |
| dw=vrelTd+vrelTs+12[v21amax−v22a2]+d0 | (7) |
where vrel is the relative velocity between the target vehicle and the preceding vehicle, a2 is the maximum deceleration of the preceding vehicle assuming that the preceding vehicle is in the most dangerous conditions, and a2 is set as –8 m/s2 in this study. d0 is the zero-speed distance between the target vehicle and the preceding vehicle, Ts is the system delay time, Td is the driver’s reaction time, and amax is the presupposed maximum deceleration of the target vehicle whose value depends on the driving style. The corresponding amax of the different style drivers are obtained through the driving simulator experiment, as shown in Table III.
The calculation equations of WT and iTTC contain both the relative distance and velocity information, which are the main factors that influence driver behaviour during the car-following and emergency collision avoidance conditions. Therefore, they are very suitable to reflect driver intentions, and their thresholds were calculated as shown in Table IV.
| Parameter | WT | iTTC |
| Aggressive | 0.60 | 0.05 |
| Ordinary | 1.30 | 0.14 |
| Cautious | 2.00 | 0.23 |
DownLoad:
CSV
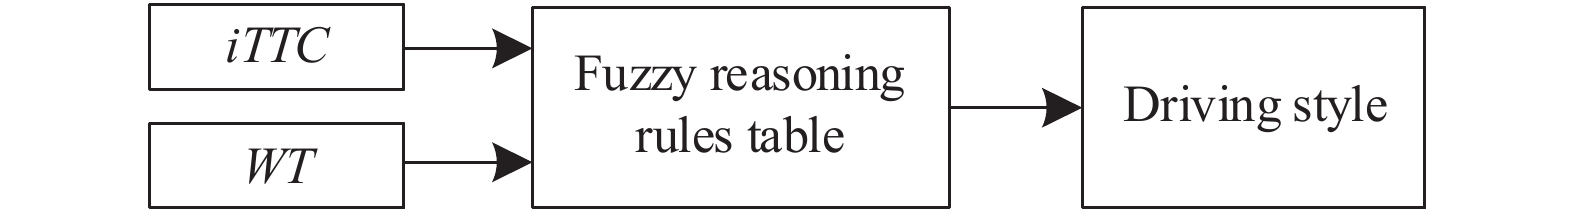
The driving style indicators iTTC and WT of each driver were obtained in real time from the driving behavioural data, and then the fuzzy reasoning rule was used to identify the driving style based on the iTTC and WT[37], [38], as shown in Fig. 2. The fuzzy reasoning rule is shown in Table V.
| Driving style | Warning index WT | |||
| Small | Medium | Large | ||
| iTTC | Small | Ordinary | Cautious | Cautious |
| Medium | Aggressive | Ordinary | Cautious | |
| Large | Aggressive | Aggressive | Ordinary | |
DownLoad:
CSV
Based on the identified driving style, the linear-quadratic (LQ) optimal control theory was used in the upper level controller to achieve driver-adaptive control. In the car-following driving condition, the state-space model of the target vehicle and preceding vehicle is described in
| ˙χ=Aχ+ba+γω=[0−100]χ+[0−1]a+[th1]ω | (8) |
where a and ω are the accelerations of the target vehicle and the preceding vehicle, respectively. The state variable is shown in
| χT=[x1x2]=[cd−cv2−v1] | (9) |
where cd is the desired safety distance between the two vehicles, c is the actual distance between the two vehicles, v1 and v2 are the velocities of the target vehicle and the preceding vehicle, respectively. Take c and the velocity difference as the feedback of the control system. The control index J is defined in (10) to minimize the error.
| J=∫∞0(χTQχ+aTRa)dt | (10) |
where Q and R are the weight matrices of the state variables and acceleration, respectively. These parameters are shown in
| Q=[ρ100ρ2],R=[r]. | (11) |
The calculated Q and R values of the different types of drivers are shown in Table VI.
| ρ1 | ρ2 | r | |
| Aggressive | 0.1 | 50 | 80 |
| Ordinary | 0.6 | 10 | 100 |
| Cautious | 1.0 | 1 | 120 |
DownLoad:
CSV
According to the state feedback principle, a = –KX the Riccati equation should be met to ensure that the control index is minimized, as shown in
| PA+ATP−PBR−1BTP+Q=0. | (12) |
In addition, the state feedback vector K is defined in
| K=R−1BTP | (13) |
where P is the Semidefinite solution of the Riccati equation, and then the desired acceleration of ACC system can be obtained by
| ac=−KX=−k1(cd−c)−k2(v2−v1). | (14) |
The values of k1 and k2 of the different types of drivers were obtained previously from the driving simulator experiments, as shown in Table III.
In the design of the fusion control strategy of CA and ACC, the warning threshold WT selects the switching moment from the ACC system to the CA system, which is the triggering condition for the CA system. The switch threshold was determined according to the driving simulation experiments, as shown in Table IV.
To solve the problem of the abrupt change in acceleration when switching from the ACC working mode to the CA working mode, the expected acceleration of the vehicle in case of an emergency was set based on the calculated acceleration of the ACC system. Thus, the acceleration of the target vehicle changes smoothly and reduces the impact force in case of a collision. This method can not only guarantee the comfort of drivers but also ensure driving safety. Three kinds of maximum braking decelerations and the corresponding braking speeds and braking moments, which are appropriate for the different driving styles, were set according to different driver adaptabilities, as shown in Fig. 3.
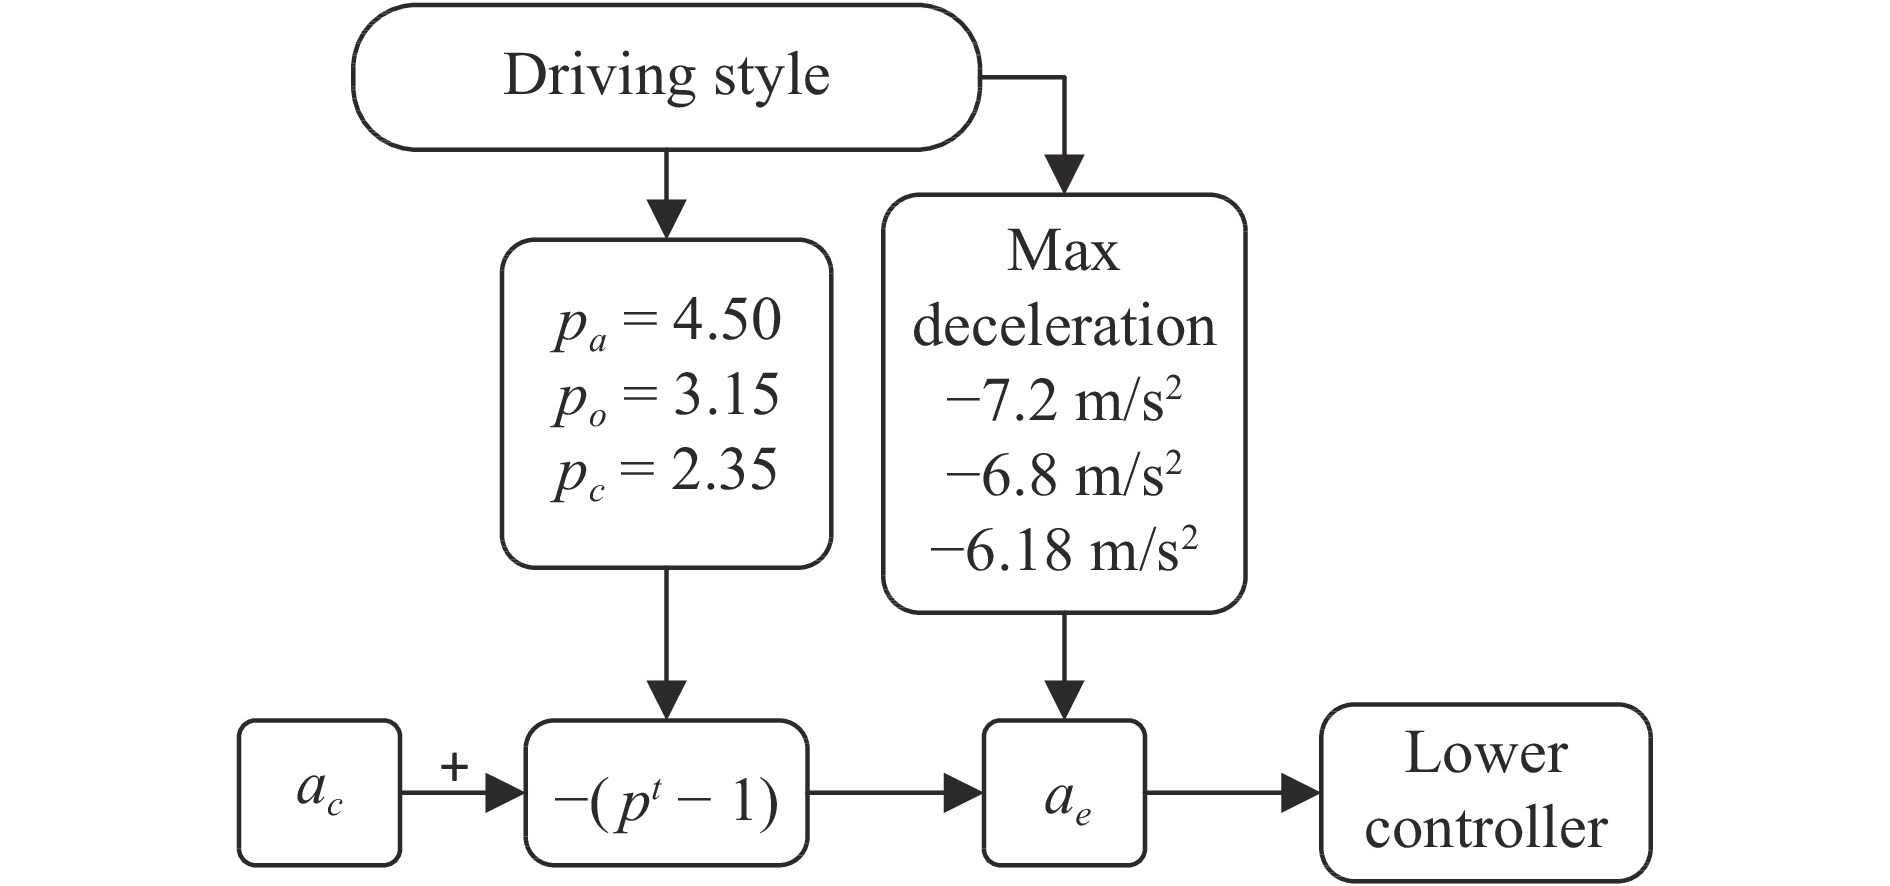
The desired acceleration of the CA system is related to parameters amax and p. Under the emergency braking condition, the braking deceleration is determined by
| ae={aca−(pta−1)ae≥−7.2m/s2aco−(pto−1)ae≥−6.8m/s2acc−(ptc−1)ae≥−6.18m/s2 | (15) |
where ae is the brake deceleration of the CA system, aca, aco, and acc are the braking decelerations of the three types of drivers in the ACC system; t is the time period from the moment of switching to the CA until switching back to the ACC again or when the vehicle is stopped. The quantity in the exponent can rapidly increase ae to ensure the collision avoidance in case of an emergency, and pa, po,
The vehicle impact degree evaluation index j is defined by
| j=dadt=d2vdt2 | (16) |
where a is the longitudinal deceleration of the target vehicle, and v is the vehicle speed. This variable reflects the change rate of deceleration. It is used to judge vehicle ride comfort in this study.
The validation virtual experiments were performed in PreScan software to verify the effect of the proposed driver-adaptive fusion control strategy of the CA and ACC systems [39]. The initial velocity and location of the target vehicle were set to zero, and another vehicle was placed in the same lane 30 m ahead of the target vehicle as the disturbance vehicle [40]. The Lidar was defined and initialized as the vehicle sensor. The inverse kinematic model of the brake and throttle, the vehicle dynamic model and the control model were established.
In the car-following driving condition, the initial velocity of the preceding disturbance vehicle was set to 8.3 m/s (30 km/h), and its detail driving conditions were set as follows: 156 m, with an even speed of 8.3 m/s (30 km/h)—124 m of acceleration, to 16.7 m/s (60 km/h)—166.6 m, with an even speed of 16.7 m/s (60 km/h)—166.6 m of deceleration, to 5.6 m/s (20 km/h)—300 m, with an even speed of 5.6 m/s (20 km/h).
In the emergency collision avoidance condition, the initial velocity of the preceding vehicle was 15 m/s (54 km/h), which braked urgently, with a deceleration of –8 m/s2.
In the car-following condition, the control strategy assigns the control system that works in the ACC mode. In it, the target vehicle actively followed the front car with one of the three cruise modes according to the driver’s driving style. The relative velocity and distance between the vehicles determined whether to accelerate or decelerate. The effect of the control strategy was evaluated in two aspects. One aspect was whether the controller guaranteed the driving task and ensured safe driving, and this performance was assessed in terms of velocity, following clearance and acceleration. These parameters reflect whether the target vehicle followed the front car with a suitable velocity and desired safety distance, and the outputted acceleration of the controller coincided with the expected acceleration of the different types of drivers. Another key point was whether the controller was suitable for drivers with different driving styles. This point was evaluated by observing whether the control of the speed and the distance was coordinated with the same rule of the driving simulator experiments when the controller worked in different driving style modes.
The velocity, the following clearance and the accelerations of the cautious, aggressive and ordinary driving style controllers are shown in Figs. 4–6, respectively.
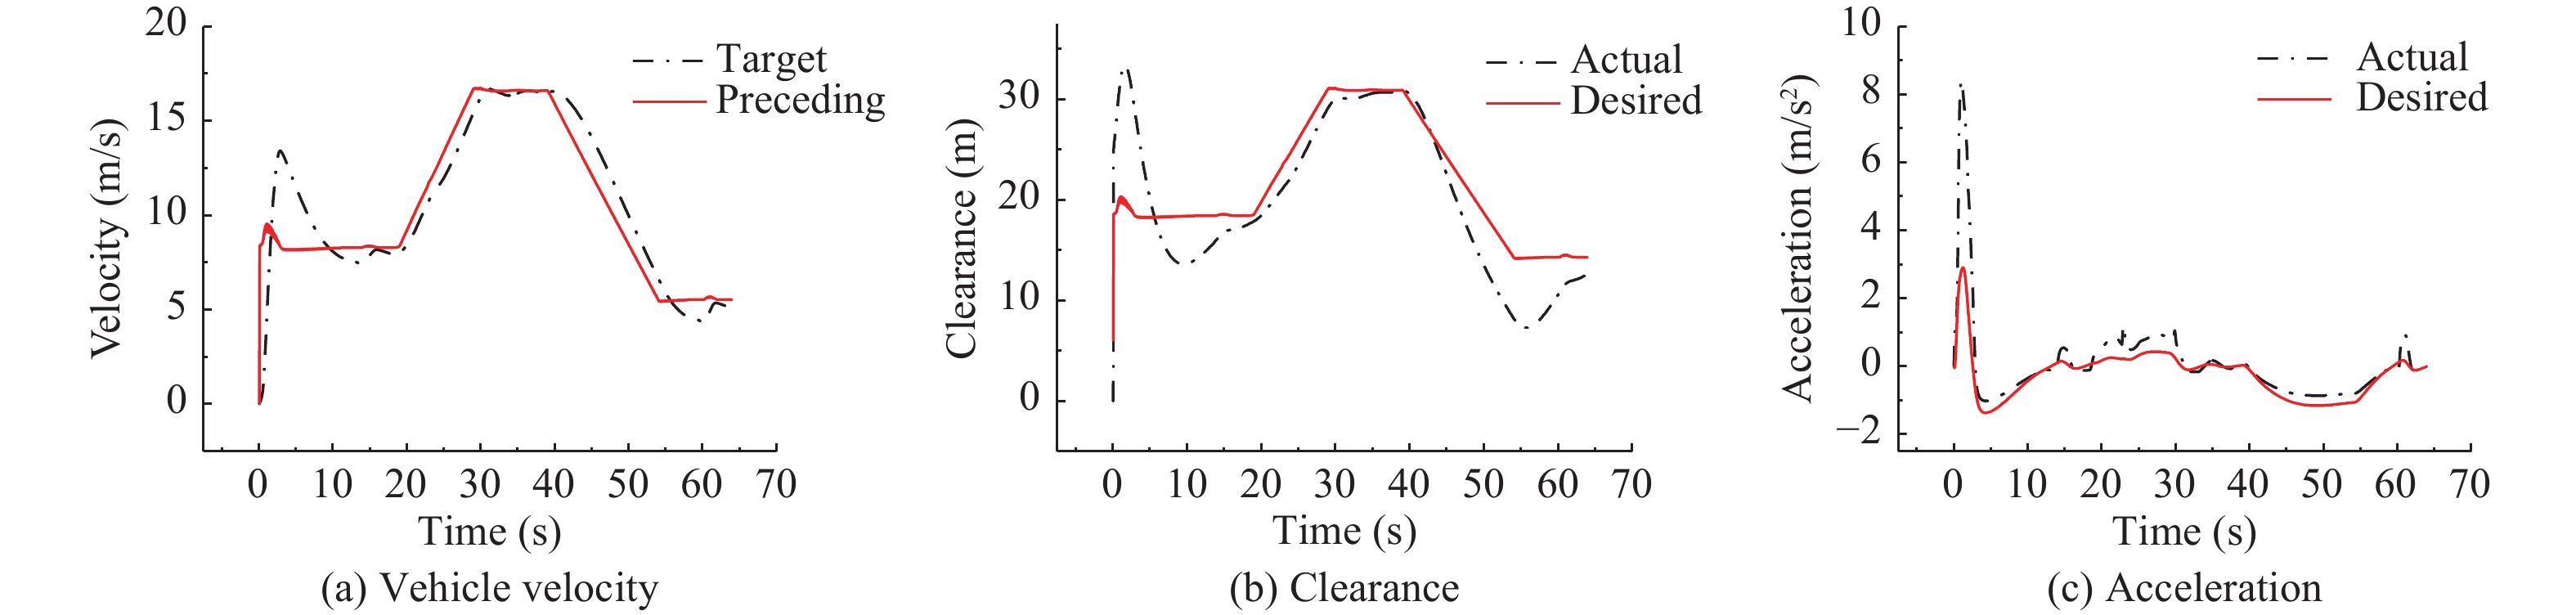
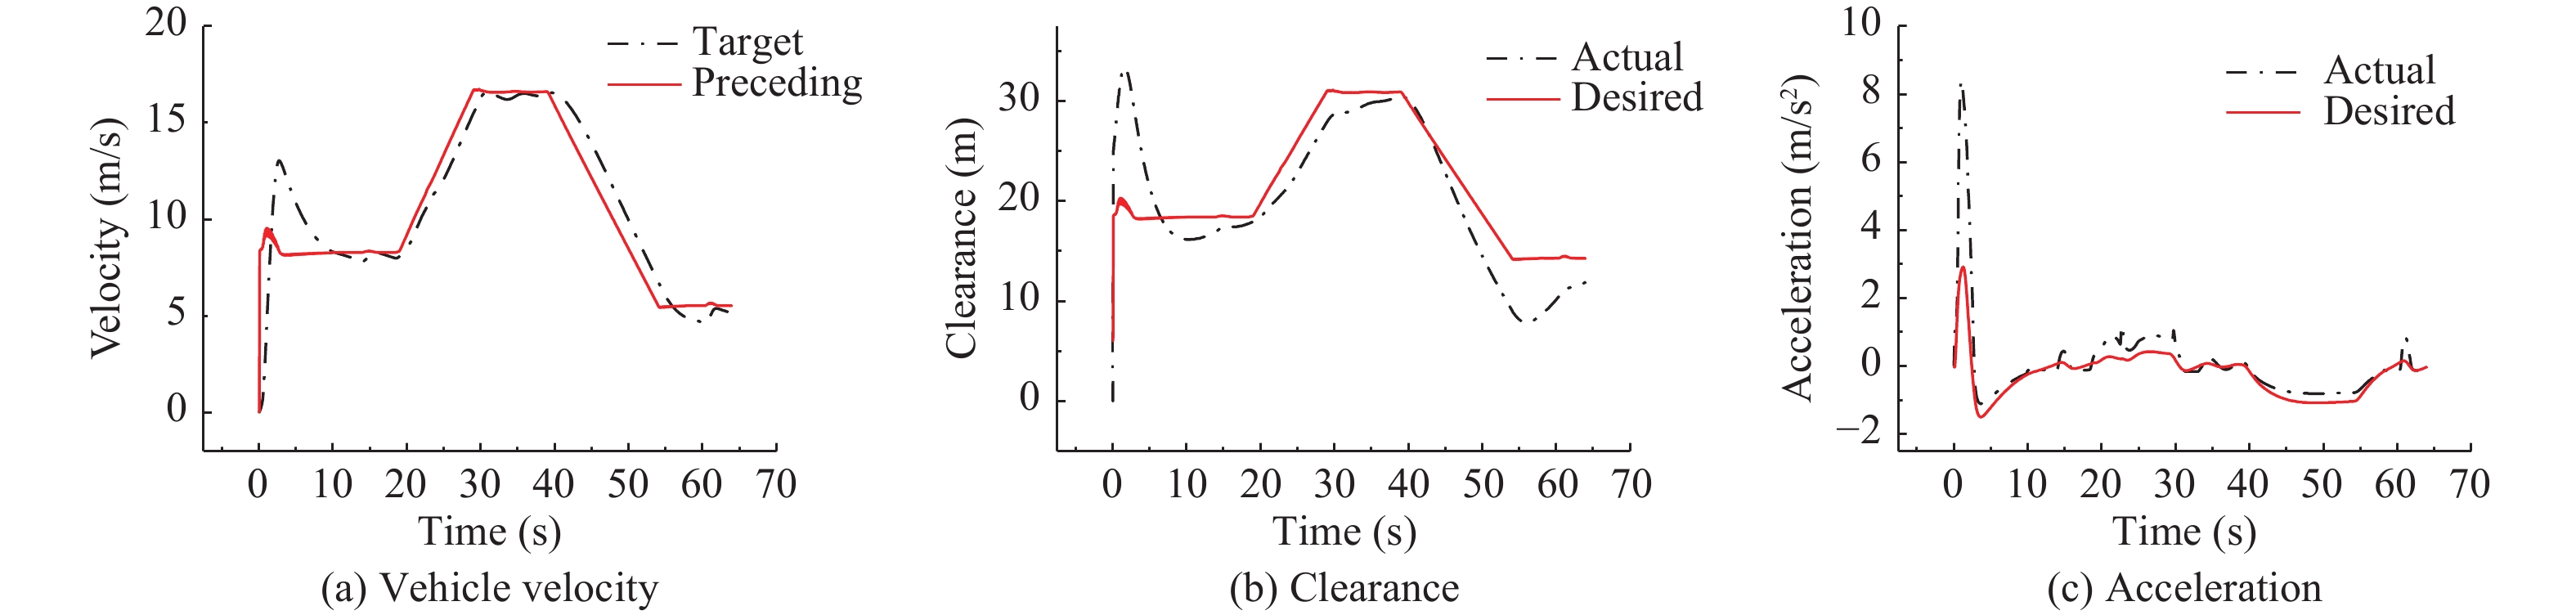
Figs. 4(a), 5(a), and 6(a) compare the velocity-time curves between the preceding vehicle and the target vehicle. It can be seen that the target vehicle in the three driving style modes followed the velocity of the preceding vehicle very well after a short period of adjustment, and the aggressive driving style controller indicated the best performance of the following velocity. The differences between the actual velocity and desired velocity of the three driving styles are shown in Fig. 7(a).

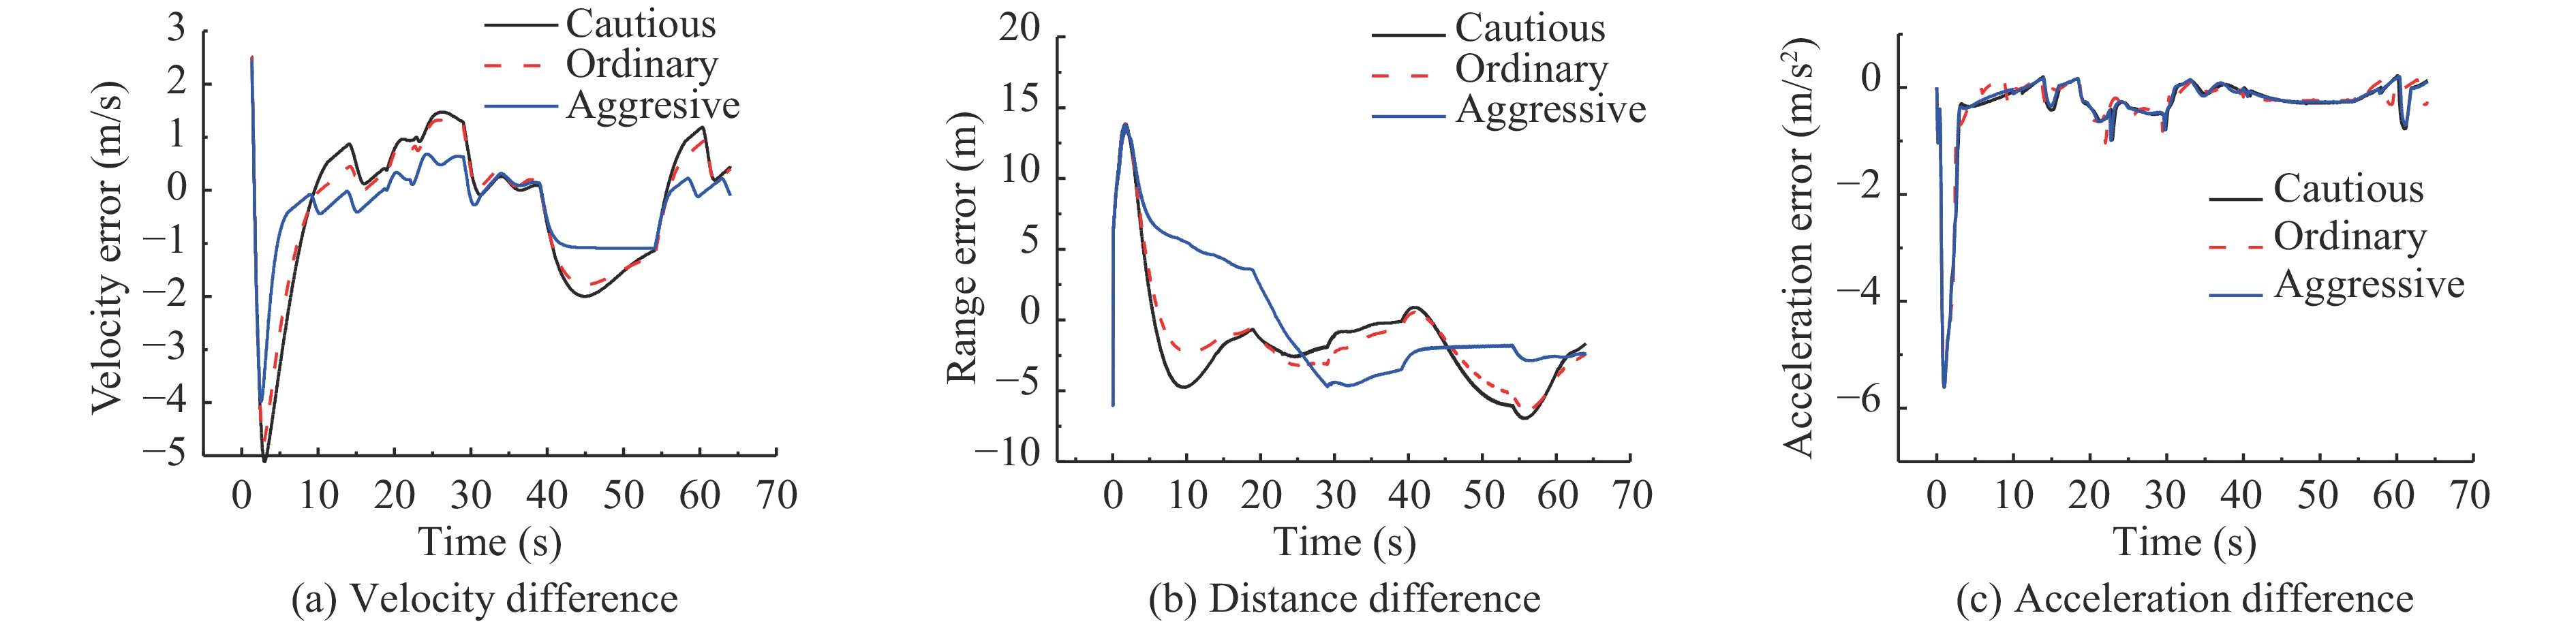
Figs. 4(b), 5(b), and Fig. 6(b) show the actual distance and desired distance of the target vehicle for the different driving styles. In the beginning, the distance between the target vehicle and the preceding vehicle was large; thus, the actual distance was larger than the desired distance. Ten seconds later, the target vehicle better followed the preceding vehicle and maintained a safe distance. The cautious driving style controller indicated the best performance of distance keeping, while the aggressive driving style controller showed the worst performance of distance keeping. The differences between the actual distance and desired distance of the three driving styles are shown in Fig. 7(b).
Figs. 4(c), 5(c), and 6(c) show the actual acceleration and desired acceleration of the target vehicle for different driving styles. Because the relative distance and relative velocity between the target vehicle and the preceding vehicle were large in the beginning, a large acceleration was generated. Five seconds later, the actual acceleration followed the desired acceleration well under all three driving style modes. The differences between the actual acceleration and the desired acceleration of the three driving styles are shown in Fig. 7(c).
We can conclude from the figures that the cautious driving style controller is more inclined to keep a safe distance, while the aggressive driving style controller tends to follow the velocity. This result is in line with the previous driving simulator experimental results, which indicated that the designed system met the requirements of different types of drivers.
The validation test results of the emergency collision avoidance driving condition are shown in Fig. 8.
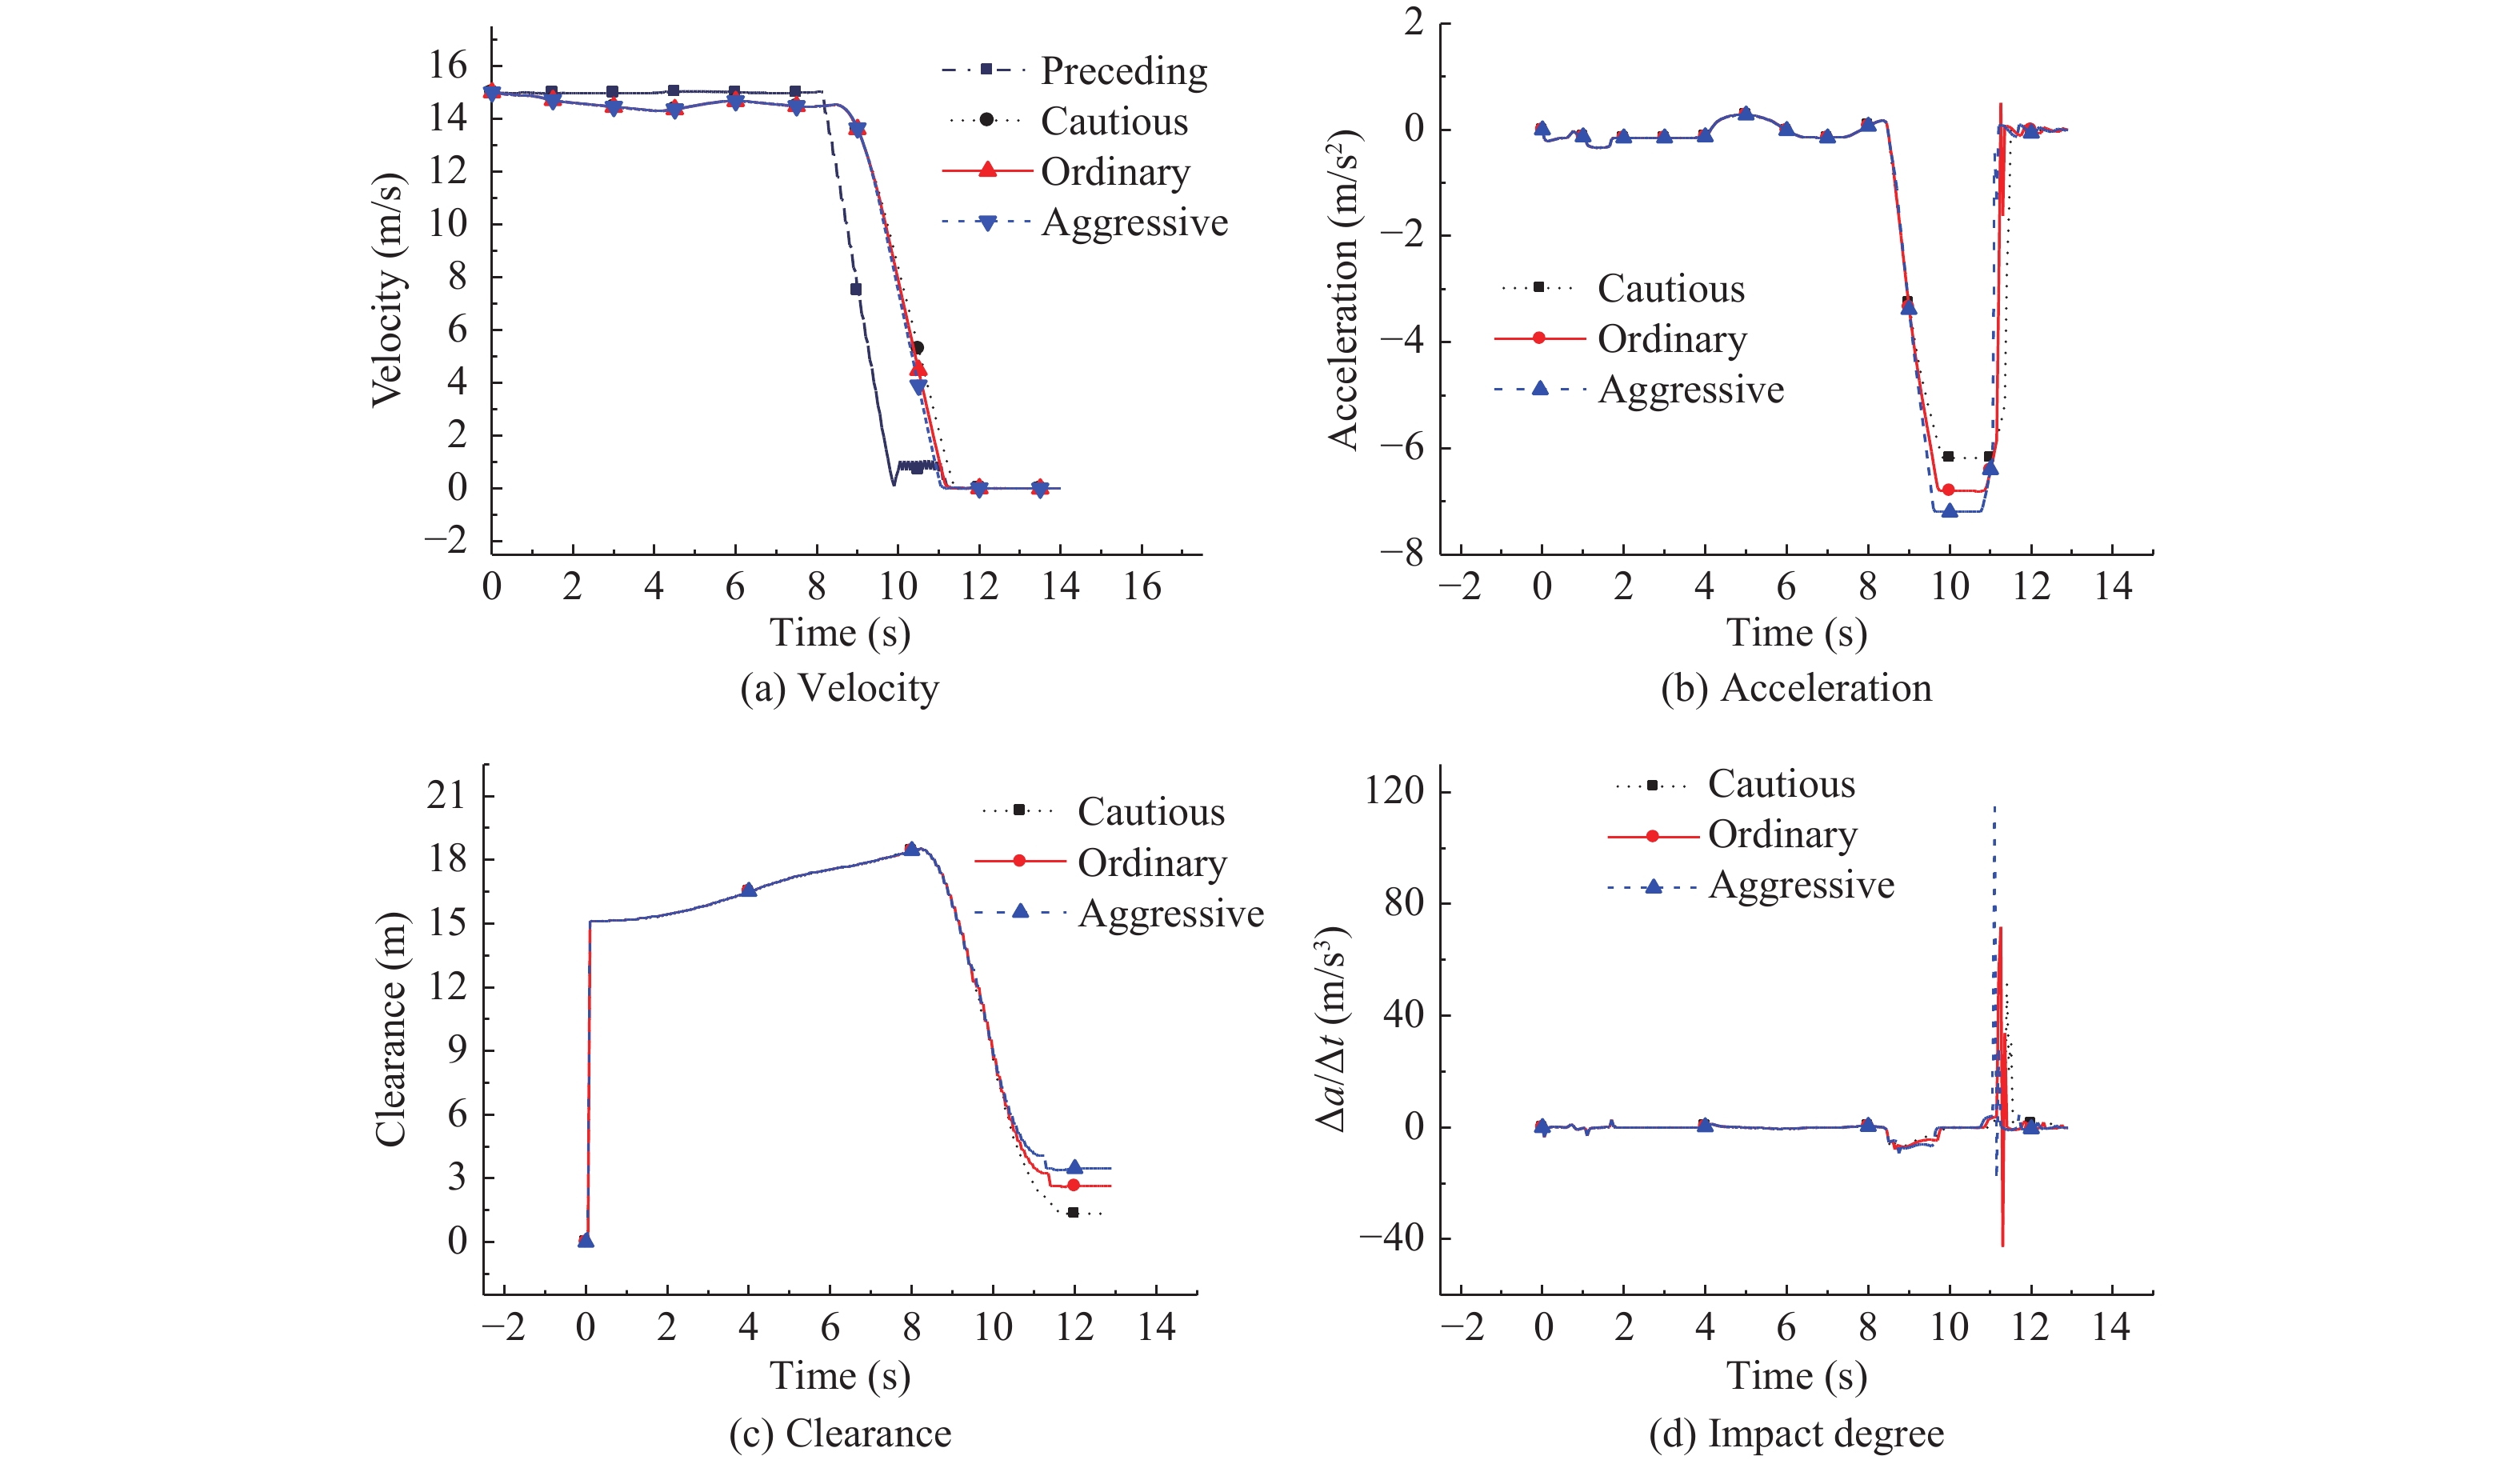
Fig. 8(a) shows the velocities of the preceding vehicle and target vehicle under the three driving style modes. All three driving style controllers conducted emergency braking to achieve collision avoidance, and the velocity time history curves of the three styles of controllers were similar. Fig. 8(b) shows the braking decelerations of different driving style controllers. It can be seen that the aggressive driver was more inclined to brake faster and to induce greater braking deceleration. Fig. 8(c) shows the relative distance between the target vehicle and the preceding vehicle during emergency braking. The cautious driving style controller maintained the smallest relative distance when the target vehicle decreased to zero. Fig. 8(d) shows the impact degrees of different driving style controllers under emergency braking conditions, which were calculated according to (16). It can be seen that the impact degrees of three styles of drivers are very smooth and steady, except one sharp impulse near the moment when the vehicle acceleration back to zero, which guarantees the driver’s comfort and safety. The aggressive driving style controller braking impact degree are larger than the cautious driver braking impact degree.
To reduce the risk of vehicle collision and improve driver adaptability, a driver-adaptive fusion control strategy of the ACC and CA systems was proposed in this study. The questionnaire survey was performed to identify the driver type, including aggressive, ordinary and cautious types, and the corresponding driving behavioural data were collected via the driving simulator experiments. The experiment results show that different styles of drivers have significant differences in their respective driving behaviours. Aggressive drivers are more inclined to accelerate during car-following driving conditions and are more inclined to have greater braking speeds and braking forces in emergency collision avoidance conditions. Meanwhile, cautious drivers tend to keep an appropriate clearance from the preceding vehicle in car-following conditions and have relatively lower braking speeds and lower braking forces under emergency braking conditions. These driving behavioural characteristics served as the template data after the cluster analysis for the online identification of driver type and the driver-adaptive ACC/CA fusion control strategy.
The ACC system was designed based on the optimal control theory, and it is self-adaptive to different driving styles; an exponential function was added in the desired deceleration from the ACC system to form a new desired deceleration for the CA system. This CA system can output the maximum braking deceleration and braking speed according to driver style, and this method can reduce the impact severity in the case of emergency braking. Finally, the effect of the proposed fusion control strategy was verified by virtual experiments, which indicated that the proposed control strategy could achieve the fusion control of the ACC and CA systems successfully and improve driver adaptability and comfort.
However, there are still some issues that need to be further studied and improved, such as the fact that the driver-adaptive control strategy was designed based only on three driver styles. It is suggested that the system parameters can be adjusted according to the driving operations of each driver so that the system can fit each driver. In addition, experiments should be carried out according to the actual road environment with subjective and objective judgements by the experimenter.
This research complied with the ICH-GCP, “China GCP” and related regulation and law of China, and was approved by the Institutional Review Board at the Second Xiangya Hospital of Central South University. Informed consent was obtained from each participant.
| [1] |
F. Jiménez, J. E. Naranjo, J. J. Anaya, F. García, A. Ponz, and J. M. Armingol, “Advanced driver assistance system for road environments to improve safety and efficiency,” Trans. Res. Procedia, vol. 14, pp. 2245–2254, 2016. doi: 10.1016/j.trpro.2016.05.240
|
| [2] |
R. Yasrab, N. J. Gu, and X. C. Zhang, “An encoder-decoder based convolution neural network (CNN) for future advanced driver assistance system (ADAS),” Appl. Sci., vol. 7, no. 4, pp. 312, Mar. 2017. doi: 10.3390/app7040312
|
| [3] |
J. Huang, Z. X. Ji, X. Y. Peng, and L. Hu, “Driving style adaptive lane-changing trajectory planning and control,” China J. Highway Transport, vol. 32, no. 6, pp. 226–239, 247, Jun. 2019.
|
| [4] |
H. M. Xiong, L. N. Boyle, J. Moeckli, B. R. Dow, and T. L. Brown, “Use patterns among early adopters of adaptive cruise control,” Hum. Factors:J. Hum. Factors Ergon. Soc., vol. 54, no. 5, pp. 722–733, Feb. 2012. doi: 10.1177/0018720811434512
|
| [5] |
L. Hu, X. T. Hu, J. Wan, M. Lin, and J. Huang, “The injury epidemiology of adult riders in vehicle-two-wheeler crashes in China, Ningbo, 2011–2015,” J. Saf. Res., vol. 72, pp. 21–28, Feb. 2020. doi: 10.1016/j.jsr.2019.12.011
|
| [6] |
L. Hu, J. Ou, J. Huang, Y. M. Chen, and D. P. Cao, “A review of research on traffic conflicts based on intelligent vehicles,” IEEE Access, vol. 8, pp. 24471–24483, Jan. 2020. doi: 10.1109/ACCESS.2020.2970164
|
| [7] |
F. M. Poó, O. Taubman-Ben-Ari, R. D. Ledesma, and C. M. Díaz-Lázaro, “Reliability and validity of a Spanish-language version of the multidimensional driving style inventory,” Trans. Res. Part F:Traffic Psychol. Behav., vol. 17, pp. 75–87, Feb. 2013. doi: 10.1016/j.trf.2012.10.003
|
| [8] |
S. Moon and K. Yi, “Human driving data-based design of a vehicle adaptive cruise control algorithm,” Veh. Syst. Dyn., vol. 46, no. 8, pp. 661–690, Jun. 2008. doi: 10.1080/00423110701576130
|
| [9] |
G. F. B. Piccinini, C. M. Rodrigues, M. Leitão, and A. Simões, “Reaction to a critical situation during driving with adaptive cruise control for users and non-users of the system,” Saf. Sci., vol. 72, pp. 116–126, Feb. 2015. doi: 10.1016/j.ssci.2014.09.008
|
| [10] |
W. J. Schakel, C. M. Gorter, J. C. F. De Winter, and B. van Arem, “Driving characteristics and adaptive cruise control-a naturalistic driving study,” IEEE Intell. Trans. Syst. Mag., vol. 9, no. 2, pp. 17–24, Apr. 2017. doi: 10.1109/MITS.2017.2666582
|
| [11] |
F. A. Mullakkal-Babu, M. Wang, B. Van Arem, and R. Happee, “Design and analysis of full range adaptive cruise control with integrated collision a voidance strategy,” in Proc. IEEE 19th Int. Conf. Intelligent Transportation Systems, Rio de Janeiro, Brazil, 2016, pp. 308−315.
|
| [12] |
J. Q. Wang, L. Zhang, D. Z. Zhangm and K. Q. Li, “An adaptive longitudinal driving assistance system based on driver characteristics,” IEEE Trans. Intelligent Transportation Systems, vol. 14, no. 1, pp. 1–12, Jul. 2013. doi: 10.1109/TITS.2012.2205143
|
| [13] |
H. M. Xiong and L. N. Boyle, “Drivers’ adaptation to adaptive cruise control: Examination of automatic and manual braking,” IEEE Trans. Intelligent Transportation Systems, vol. 13, no. 3, pp. 1468–1473, Apr. 2012. doi: 10.1109/TITS.2012.2192730
|
| [14] |
S. Moon, I. Moon, and K. Yi, “Design, tuning, and evaluation of a full-range adaptive cruise control system with collision avoidance,” Control Eng. Pract., vol. 17, no. 4, pp. 442–455, Apr. 2009. doi: 10.1016/j.conengprac.2008.09.006
|
| [15] |
L. Hu, Y. X. Zhong, W. Hao, B. Moghimi, J. Huang, X. Zhang, and R. H. Du., “Optimal route algorithm considering traffic light and energy consumption,” IEEE Access, vol. 6, pp. 59695–59704, Sept. 2018. doi: 10.1109/ACCESS.2018.2871843
|
| [16] |
K. Gao, F. R. Han, P. P. Dong, N. X. Xiong, and R. H. Du, “Connected vehicle as a mobile sensor for real time queue length at signalized intersections,” Sensors, vol. 19, no. 9, pp. 2059, May 2019. doi: 10.3390/s19092059
|
| [17] |
D. B. Zhao, Z. H. Hu, Z. P. Xia, C. Alippi, Y. H. Zhu, and D. Wang, “Full-range adaptive cruise control based on supervised adaptive dynamic programming,” Neurocomputing, vol. 125, pp. 57–67, Feb. 2014. doi: 10.1016/j.neucom.2012.09.034
|
| [18] |
L. H. Luo, P. Li, and H. Wang, “Model predictive control for adaptive cruise control with multi-objectives: Comfort, fuel-economy, safety and car-following,” J. Zhejiang Univ. SCI. A, vol. 11, no. 3, pp. 191–201, Feb. 2010. doi: 10.1631/jzus.A0900374
|
| [19] |
L. Hu, X. H. Wu, J. Huang, Y. Peng, and W. G. Liu, “Investigation of clusters and injuries in pedestrian crashes using GIS in Changsha, China,” Saf. Sci., vol. 127, pp. 104710, Jul. 2020. doi: 10.1016/j.ssci.2020.104710
|
| [20] |
A. Weißmann, D. Görges, and X. H. Lin, “Energy-optimal adaptive cruise control combining model predictive control and dynamic programming,” Control Eng. Pract., vol. 72, pp. 125–137, Mar. 2018. doi: 10.1016/j.conengprac.2017.12.001
|
| [21] |
G. J. L. Naus, R. P. A. Vugts, J. Ploeg, M. J. G. Van De Molengraft, and M. Steinbuch, “String-stable CACC design and experimental validation: a frequency-domain approach,” IEEE Trans. Veh. Technol., vol. 59, no. 9, pp. 4268–4279, Nov. 2010. doi: 10.1109/TVT.2010.2076320
|
| [22] |
L. Hu, X. S. Hu, Y. H. Che, F. Feng, X. K. Lin, and Z. Y. Zhang, “Reliable state of charge estimation of battery packs using fuzzy adaptive federated filtering,” Appl. Energy, vol. 262, pp. 114569, Mar. 2020. doi: 10.1016/j.apenergy.2020.114569
|
| [23] |
K. C. Dey, L. Yan, X. J. Wang, Y. Wang, H. Y. Shen, M. Chowdhury, L. Yu, C. X. Qiu, and V. Soundararaj, “A review of communication, driver characteristics, and controls aspects of cooperative adaptive cruise control (CACC),” IEEE Trans. Intelligent Transportation Systems, vol. 17, no. 2, pp. 491–509, Feb. 2016. doi: 10.1109/TITS.2015.2483063
|
| [24] |
T. Hirose, Y. Ohtsuka, and M. Gokan, “Activation timing of a collision avoidance system with V2V communication,” SAE, SAE Tech. Paper 2017-01-0039, 2017.
|
| [25] |
S. Y. Gelbal, S. Zhu, G. A. Anantharaman, B. A. Guvenc, and L. Guvenc, “Cooperative collision avoidance in a connected vehicle environment,” SAE, SAE Tech. Paper 2019-01-0488, 2019.
|
| [26] |
I. Koglbauer, J. Holzinger, A. Eichberger, and C. Lex, “Drivers’ interaction with adaptive cruise control on dry and snowy roads with various tire-road grip potentials,” J. Adv. Transp., vol. 2017, pp. 5496837, Jan. 2017.
|
| [27] |
M. G. Plessen, D. Bernardini, H. Esen, and A. Bemporad, “Spatial-based predictive control and geometric corridor planning for adaptive cruise control coupled with obstacle avoidance,” IEEE Trans. Control Syst. Technol., vol. 26, no. 1, pp. 38–50, Jan. 2018. doi: 10.1109/TCST.2017.2664722
|
| [28] |
J. Huang, X. Luo, and X. Y. Peng, “A novel classification method for a driver’s cognitive stress level by transferring interbeat intervals of the ECG signal to pictures,” Sensors, vol. 20, no. 5, pp. 1340, 2020. doi: 10.3390/s20051340
|
| [29] |
P. Nilsson, O. Hussien, A. Balkan, Y. X. Chen, A. D. Ames, J. W. Grizzle, N. Ozay, H. Peng, and P. Tabuada, “Correct-by-construction adaptive cruise control: Two approaches,” IEEE Trans. Control Syst. Technol., vol. 24, no. 4, pp. 1294–1307, Jul. 2016. doi: 10.1109/TCST.2015.2501351
|
| [30] |
Y. T. Ba, W. Zhang, G. Salvendy, A. S. K. Cheng, and P. Ventsislavova, “Assessments of risky driving: A Go/No-Go simulator driving task to evaluate risky decision-making and associated behavioral patterns,” Appl. Ergon., vol. 52, pp. 265–274, Jan. 2016. doi: 10.1016/j.apergo.2015.07.020
|
| [31] |
O. Taubman-Ben-Ari, M. Mikulincer, and O. Gillath, “The multidimensional driving style inventory—scale construct and validation,” Accid. Anal. Prev., vol. 36, no. 3, pp. 323–332, May 2004. doi: 10.1016/S0001-4575(03)00010-1
|
| [32] |
O. Taubman-Ben-Ari and V. Skvirsky, “The multidimensional driving style inventory a decade later: Review of the literature and re-evaluation of the scale,” Accid. Anal. Prev., vol. 93, pp. 179–188, Aug. 2016. doi: 10.1016/j.aap.2016.04.038
|
| [33] |
C. Lu, F. Q. Hu, D. P. Cao, J. W. Gong, Y. Xing, and Z. R. Li, “Virtual-to-real knowledge transfer for driving behavior recognition: Framework and a case study,” IEEE Trans. Veh. Technol., vol. 68, no. 7, pp. 6391–6402, Jul. 2019. doi: 10.1109/TVT.2019.2917025
|
| [34] |
Y. Xing, C. Lv, H. J. Wang, D. P. Cao, E. Velenis, and F. Y. Wang, “Driver activity recognition for intelligent vehicles: A deep learning approach,” IEEE Trans. Veh. Technol., vol. 68, no. 6, pp. 5379–5390, Jun. 2019. doi: 10.1109/TVT.2019.2908425
|
| [35] |
B. K. Sahu, T. K. Pati, J. R. Nayak, S. Panda, and S. K. Kar, “A novel hybrid LUS–TLBO optimized fuzzy-PID controller for load frequency control of multi-source power system,” Int. J. Electr. Power Energy Syst., vol. 74, pp. 58–69, Jan. 2016. doi: 10.1016/j.ijepes.2015.07.020
|
| [36] |
X. K. Wang and L. Wang, “Design and research based on fuzzy PID-parameters self-tuning controller with MATLAB,” New Technol. New Process, vol. 11, pp. 26–28, 2016.
|
| [37] |
S. Kantor and T. Stárek, “Design of algorithms for payment telematics systems evaluating driver’s driving style,” Trans. Transp. Sci., vol. 7, no. 1, pp. 9–16, Jan. 2014. doi: 10.2478/v10158-012-0049-5
|
| [38] |
L. M. Niu, H. Y. Yang, and Y. H. Zhang, “Intelligent HEV fuzzy logic control strategy based on identification and prediction of drive cycle and driving trend,” World J. Eng. Technol., vol. 3, no. 3C, pp. 215–226, Oct. 2015.
|
| [39] |
X. X. Xiong, L. Chen, and J. Liang, “New framework of vehicle collision prediction by combining SVM and HMM,” IEEE Trans. Intelligent Transportation Systems, vol. 19, no. 3, pp. 699–710, Mar. 2018. doi: 10.1109/TITS.2017.2699191
|
| [40] |
Y. Peng, C. J. Fan, L. Hu, S. L. Peng, P. P. Xie, F. G. Wu, and S. E. Yi, “Tunnel driving occupational environment and hearing loss in train drivers in China,” Occup. Environ. Med., vol. 76, no. 2, pp. 97–104, Feb. 2019. doi: 10.1136/oemed-2018-105269
|
| [1] | Kamal Rsetam, Zhenwei Cao, Zhihong Man, Xian-Ming Zhang. GPIO-Based Continuous Sliding Mode Control for Networked Control Systems Under Communication Delays With Experiments on Servo Motors[J]. IEEE/CAA Journal of Automatica Sinica, 2025, 12(1): 99-113. doi: 10.1109/JAS.2024.124812 |
| [2] | Shiying Zhao, Qingxin Meng, Xuzhi Lai, Jinhua She, Edwardo Fumihiko Fukushima, Min Wu. Length-Variable Bionic Continuum Robot With Millimeter-Scale Diameter and Compliant Driving Force[J]. IEEE/CAA Journal of Automatica Sinica, 2025, 12(4): 655-667. doi: 10.1109/JAS.2024.125091 |
| [3] | Jiacheng Li, Wenhui Ma, YangWang Fang, Dengxiu Yu, C. L. Philip Chen. Collision-Free Maneuvering for a UAV Swarm Based on Parallel Control[J]. IEEE/CAA Journal of Automatica Sinica, 2025, 12(4): 761-775. doi: 10.1109/JAS.2024.124674 |
| [4] | Zheng Chen, Shizhao Zhou, Chong Shen, Litong Lyu, Junhui Zhang, Bin Yao. Observer-Based Adaptive Robust Precision Motion Control of a Multi-Joint Hydraulic Manipulator[J]. IEEE/CAA Journal of Automatica Sinica, 2024, 11(5): 1213-1226. doi: 10.1109/JAS.2024.124209 |
| [5] | Yunjun Zheng, Jinchuan Zheng, Ke Shao, Han Zhao, Hao Xie, Hai Wang. Adaptive Trajectory Tracking Control for Nonholonomic Wheeled Mobile Robots: A Barrier Function Sliding Mode Approach[J]. IEEE/CAA Journal of Automatica Sinica, 2024, 11(4): 1007-1021. doi: 10.1109/JAS.2023.124002 |
| [6] | Li-Ying Hao, Gege Dong, Tieshan Li, Zhouhua Peng. Path-Following Control With Obstacle Avoidance of Autonomous Surface Vehicles Subject to Actuator Faults[J]. IEEE/CAA Journal of Automatica Sinica, 2024, 11(4): 956-964. doi: 10.1109/JAS.2023.123675 |
| [7] | Hongru Ren, Hui Ma, Hongyi Li, Zhenyou Wang. Adaptive Fixed-Time Control of Nonlinear MASs With Actuator Faults[J]. IEEE/CAA Journal of Automatica Sinica, 2023, 10(5): 1252-1262. doi: 10.1109/JAS.2023.123558 |
| [8] | Yanping Xu, Lu Liu, Nan Gu, Dan Wang, Zhouhua Peng. Multi-ASV Collision Avoidance for Point-to-Point Transitions Based on Heading-Constrained Control Barrier Functions With Experiment[J]. IEEE/CAA Journal of Automatica Sinica, 2023, 10(6): 1494-1497. doi: 10.1109/JAS.2022.105995 |
| [9] | Linling Wang, Daqi Zhu, Wen Pang, Chaomin Luo. A Novel Obstacle Avoidance Consensus Control for Multi-AUV Formation System[J]. IEEE/CAA Journal of Automatica Sinica, 2023, 10(5): 1304-1318. doi: 10.1109/JAS.2023.123201 |
| [10] | Shengnan Gao, Zhouhua Peng, Haoliang Wang, Lu Liu, Dan Wang. Safety-Critical Model-Free Control for Multi-Target Tracking of USVs with Collision Avoidance[J]. IEEE/CAA Journal of Automatica Sinica, 2022, 9(7): 1323-1326. doi: 10.1109/JAS.2022.105707 |
| [11] | Xiaohua Ge, Qing-Long Han, Jun Wang, Xian-Ming Zhang. A Scalable Adaptive Approach to Multi-Vehicle Formation Control with Obstacle Avoidance[J]. IEEE/CAA Journal of Automatica Sinica, 2022, 9(6): 990-1004. doi: 10.1109/JAS.2021.1004263 |
| [12] | Chaoyue Zu, Chao Yang, Jian Wang, Wenbin Gao, Dongpu Cao, Fei-Yue Wang. Simulation and Field Testing of Multiple Vehicles Collision Avoidance Algorithms[J]. IEEE/CAA Journal of Automatica Sinica, 2020, 7(4): 1045-1063. doi: 10.1109/JAS.2020.1003246 |
| [13] | Li Li, Xinyu Peng, Fei-Yue Wang, Dongpu Cao, Lingxi Li. A Situation-Aware Collision Avoidance Strategy for Car-Following[J]. IEEE/CAA Journal of Automatica Sinica, 2018, 5(5): 1012-1016. doi: 10.1109/JAS.2018.7511198 |
| [14] | Arindam Mondal, Laxmidhar Behera, Soumya Ranjan Sahoo, Anupam Shukla. A Novel Multi-agent Formation Control Law With Collision Avoidance[J]. IEEE/CAA Journal of Automatica Sinica, 2017, 4(3): 558-568. doi: 10.1109/JAS.2017.7510565 |
| [15] | Jiacai Huang, YangQuan Chen, Haibin Li, Xinxin Shi. Fractional Order Modeling of Human Operator Behavior with Second Order Controlled Plant and Experiment Research[J]. IEEE/CAA Journal of Automatica Sinica, 2016, 3(3): 271-280. |
| [16] | Norelys Aguila-Camacho, Manuel A. Duarte-Mermoud. Improving the Control Energy in Model Reference Adaptive Controllers Using Fractional Adaptive Laws[J]. IEEE/CAA Journal of Automatica Sinica, 2016, 3(3): 332-337. |
| [17] | Hejin Zhang, Zhiyun Zhao, Ziyang Meng, Zongli Lin. Experimental Verification of a Multi-robot Distributed Control Algorithm with Containment and Group Dispersion Behaviors: the Case of Dynamic Leaders[J]. IEEE/CAA Journal of Automatica Sinica, 2014, 1(1): 54-60. |
| [18] | Nhan T. Nguyen, Sivasubramanya N. Balakrishnan. Bi-Objective Optimal Control Modification Adaptive Control for Systems with Input Uncertainty[J]. IEEE/CAA Journal of Automatica Sinica, 2014, 1(4): 423-434. |
| [19] | Rubo Zhang, Pingpeng Tang, Yumin Su, Xueyao Li, Ge Yang, Changting Shi. An Adaptive Obstacle Avoidance Algorithm for Unmanned Surface Vehicle in Complicated Marine Environments[J]. IEEE/CAA Journal of Automatica Sinica, 2014, 1(4): 385-396. |
| [20] | Xiaoming Sun, Shuzhi Sam Ge. Adaptive Neural Region Tracking Control of Multi-fully Actuated Ocean Surface Vessels[J]. IEEE/CAA Journal of Automatica Sinica, 2014, 1(1): 77-83. |

Figures(8) / Tables(6)


Jing Huang, Yimin Chen, Xiaoyan Peng, Lin Hu and Dongpu Cao, "Study on the Driving Style Adaptive Vehicle Longitudinal Control Strategy," IEEE/CAA J. Autom. Sinica, vol. 7, no. 4, pp. 1107-1115, July 2020. doi: 10.1109/JAS.2020.1003261
| Time | Collected data | |||
| t1 | v1 | v2 | a | c |
| t2 | v1 | v2 | - | c |
DownLoad:
CSV
| Time | Collected data | |||
| t1 | v1 | v2 | ac | c |
| t2 | amax | |||
DownLoad:
CSV
| Characteristics | ACC | CA | ||
| k1 | k2 | amax | p | |
| Aggressive | 0.0354 | –0.8341 | –7.2000 | 4.5000 |
| Ordinary | 0.0775 | –0.5049 | –6.8000 | 3.1500 |
| Cautious | 0.0913 | –0.4369 | –6.1800 | 2.3500 |
DownLoad:
CSV
| Parameter | WT | iTTC |
| Aggressive | 0.60 | 0.05 |
| Ordinary | 1.30 | 0.14 |
| Cautious | 2.00 | 0.23 |
DownLoad:
CSV
| Driving style | Warning index WT | |||
| Small | Medium | Large | ||
| iTTC | Small | Ordinary | Cautious | Cautious |
| Medium | Aggressive | Ordinary | Cautious | |
| Large | Aggressive | Aggressive | Ordinary | |
DownLoad:
CSV
| ρ1 | ρ2 | r | |
| Aggressive | 0.1 | 50 | 80 |
| Ordinary | 0.6 | 10 | 100 |
| Cautious | 1.0 | 1 | 120 |
DownLoad:
CSV
| Time | Collected data | |||
| t1 | v1 | v2 | a | c |
| t2 | v1 | v2 | - | c |
| Time | Collected data | |||
| t1 | v1 | v2 | ac | c |
| t2 | amax | |||
| Characteristics | ACC | CA | ||
| k1 | k2 | amax | p | |
| Aggressive | 0.0354 | –0.8341 | –7.2000 | 4.5000 |
| Ordinary | 0.0775 | –0.5049 | –6.8000 | 3.1500 |
| Cautious | 0.0913 | –0.4369 | –6.1800 | 2.3500 |
| Parameter | WT | iTTC |
| Aggressive | 0.60 | 0.05 |
| Ordinary | 1.30 | 0.14 |
| Cautious | 2.00 | 0.23 |
| Driving style | Warning index WT | |||
| Small | Medium | Large | ||
| iTTC | Small | Ordinary | Cautious | Cautious |
| Medium | Aggressive | Ordinary | Cautious | |
| Large | Aggressive | Aggressive | Ordinary | |
| ρ1 | ρ2 | r | |
| Aggressive | 0.1 | 50 | 80 |
| Ordinary | 0.6 | 10 | 100 |
| Cautious | 1.0 | 1 | 120 |


 DownLoad:


 DownLoad:


