Processing math: 100%
A journal of IEEE and CAA , publishes high-quality papers in English on original theoretical/experimental research and development in all areas of automation
Y.-C. Li, R.-S. Jia, Y.-X. Hu, and  H.-M. Sun,  “A weakly-supervised crowd density estimation method based on two-stage linear feature calibration,” IEEE/CAA J. Autom. Sinica, vol. 11, no. 4, pp. 965–981, Apr. 2024. doi: 10.1109/JAS.2023.123960
Citation: Y.-C. Li, R.-S. Jia, Y.-X. Hu, and  H.-M. Sun,  “A weakly-supervised crowd density estimation method based on two-stage linear feature calibration,” IEEE/CAA J. Autom. Sinica, vol. 11, no. 4, pp. 965–981, Apr. 2024. doi: 10.1109/JAS.2023.123960

A Weakly-Supervised Crowd Density Estimation Method Based on Two-Stage Linear Feature Calibration

doi: 10.1109/JAS.2023.123960
Funds:  This work was supported by the Humanities and Social Science Fund of the Ministry of Education of China (21YJAZH077)
More Information
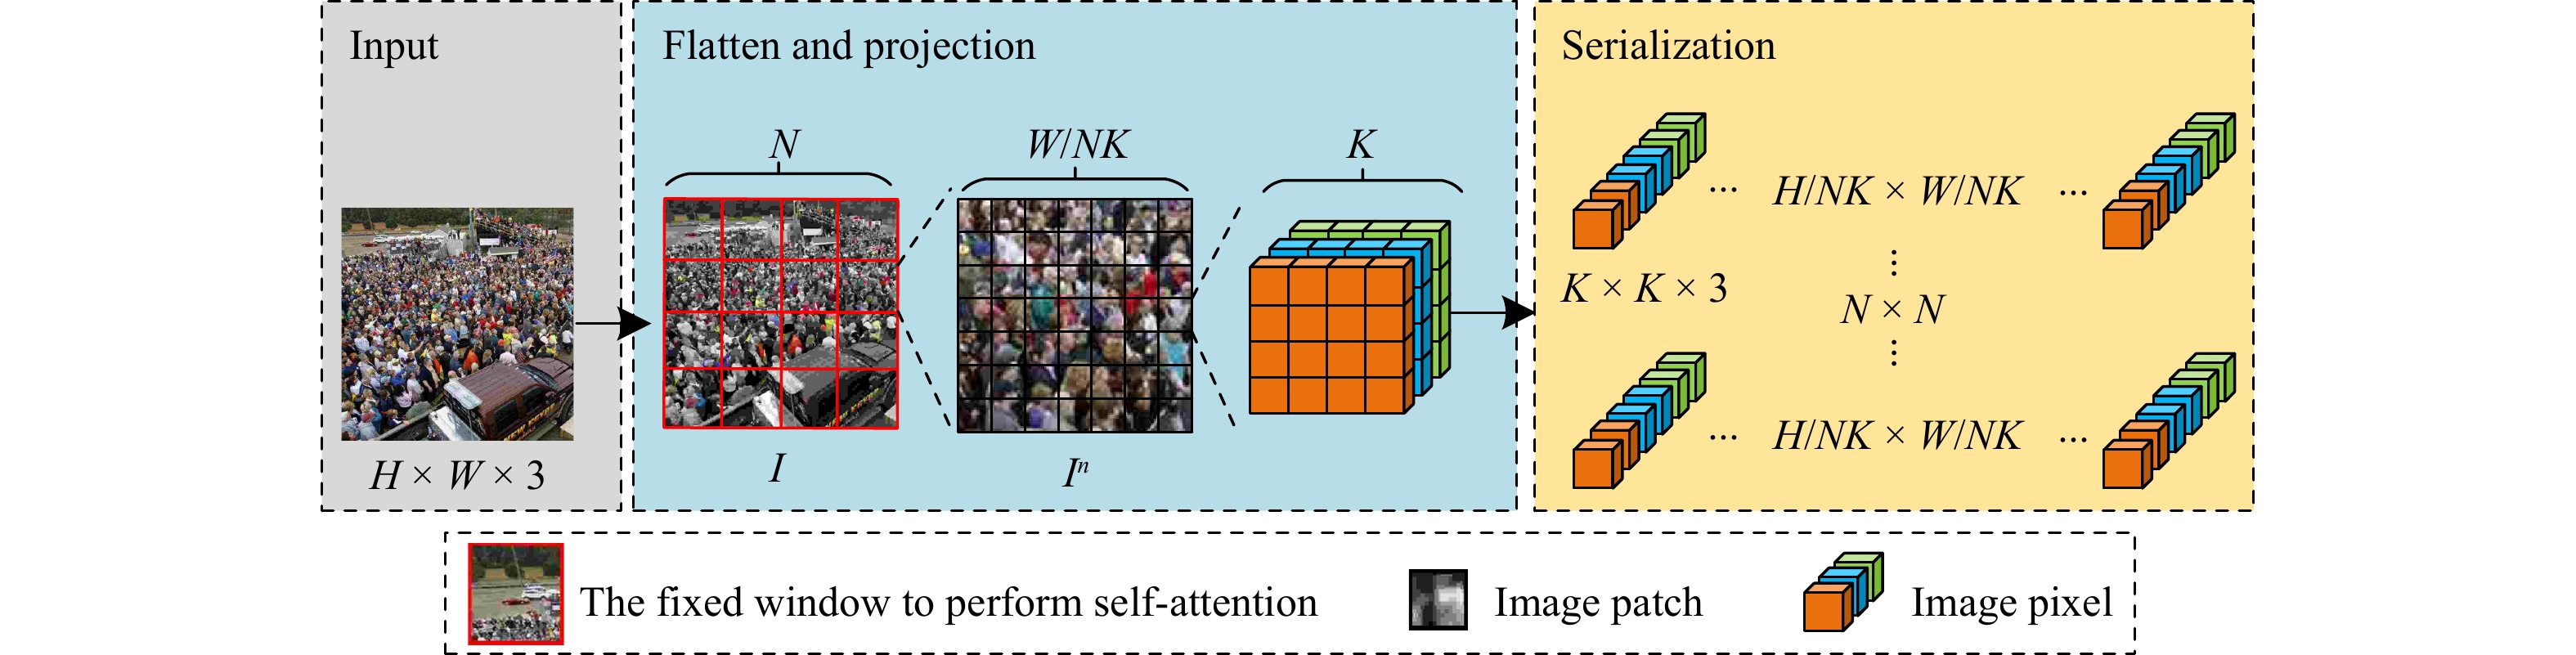
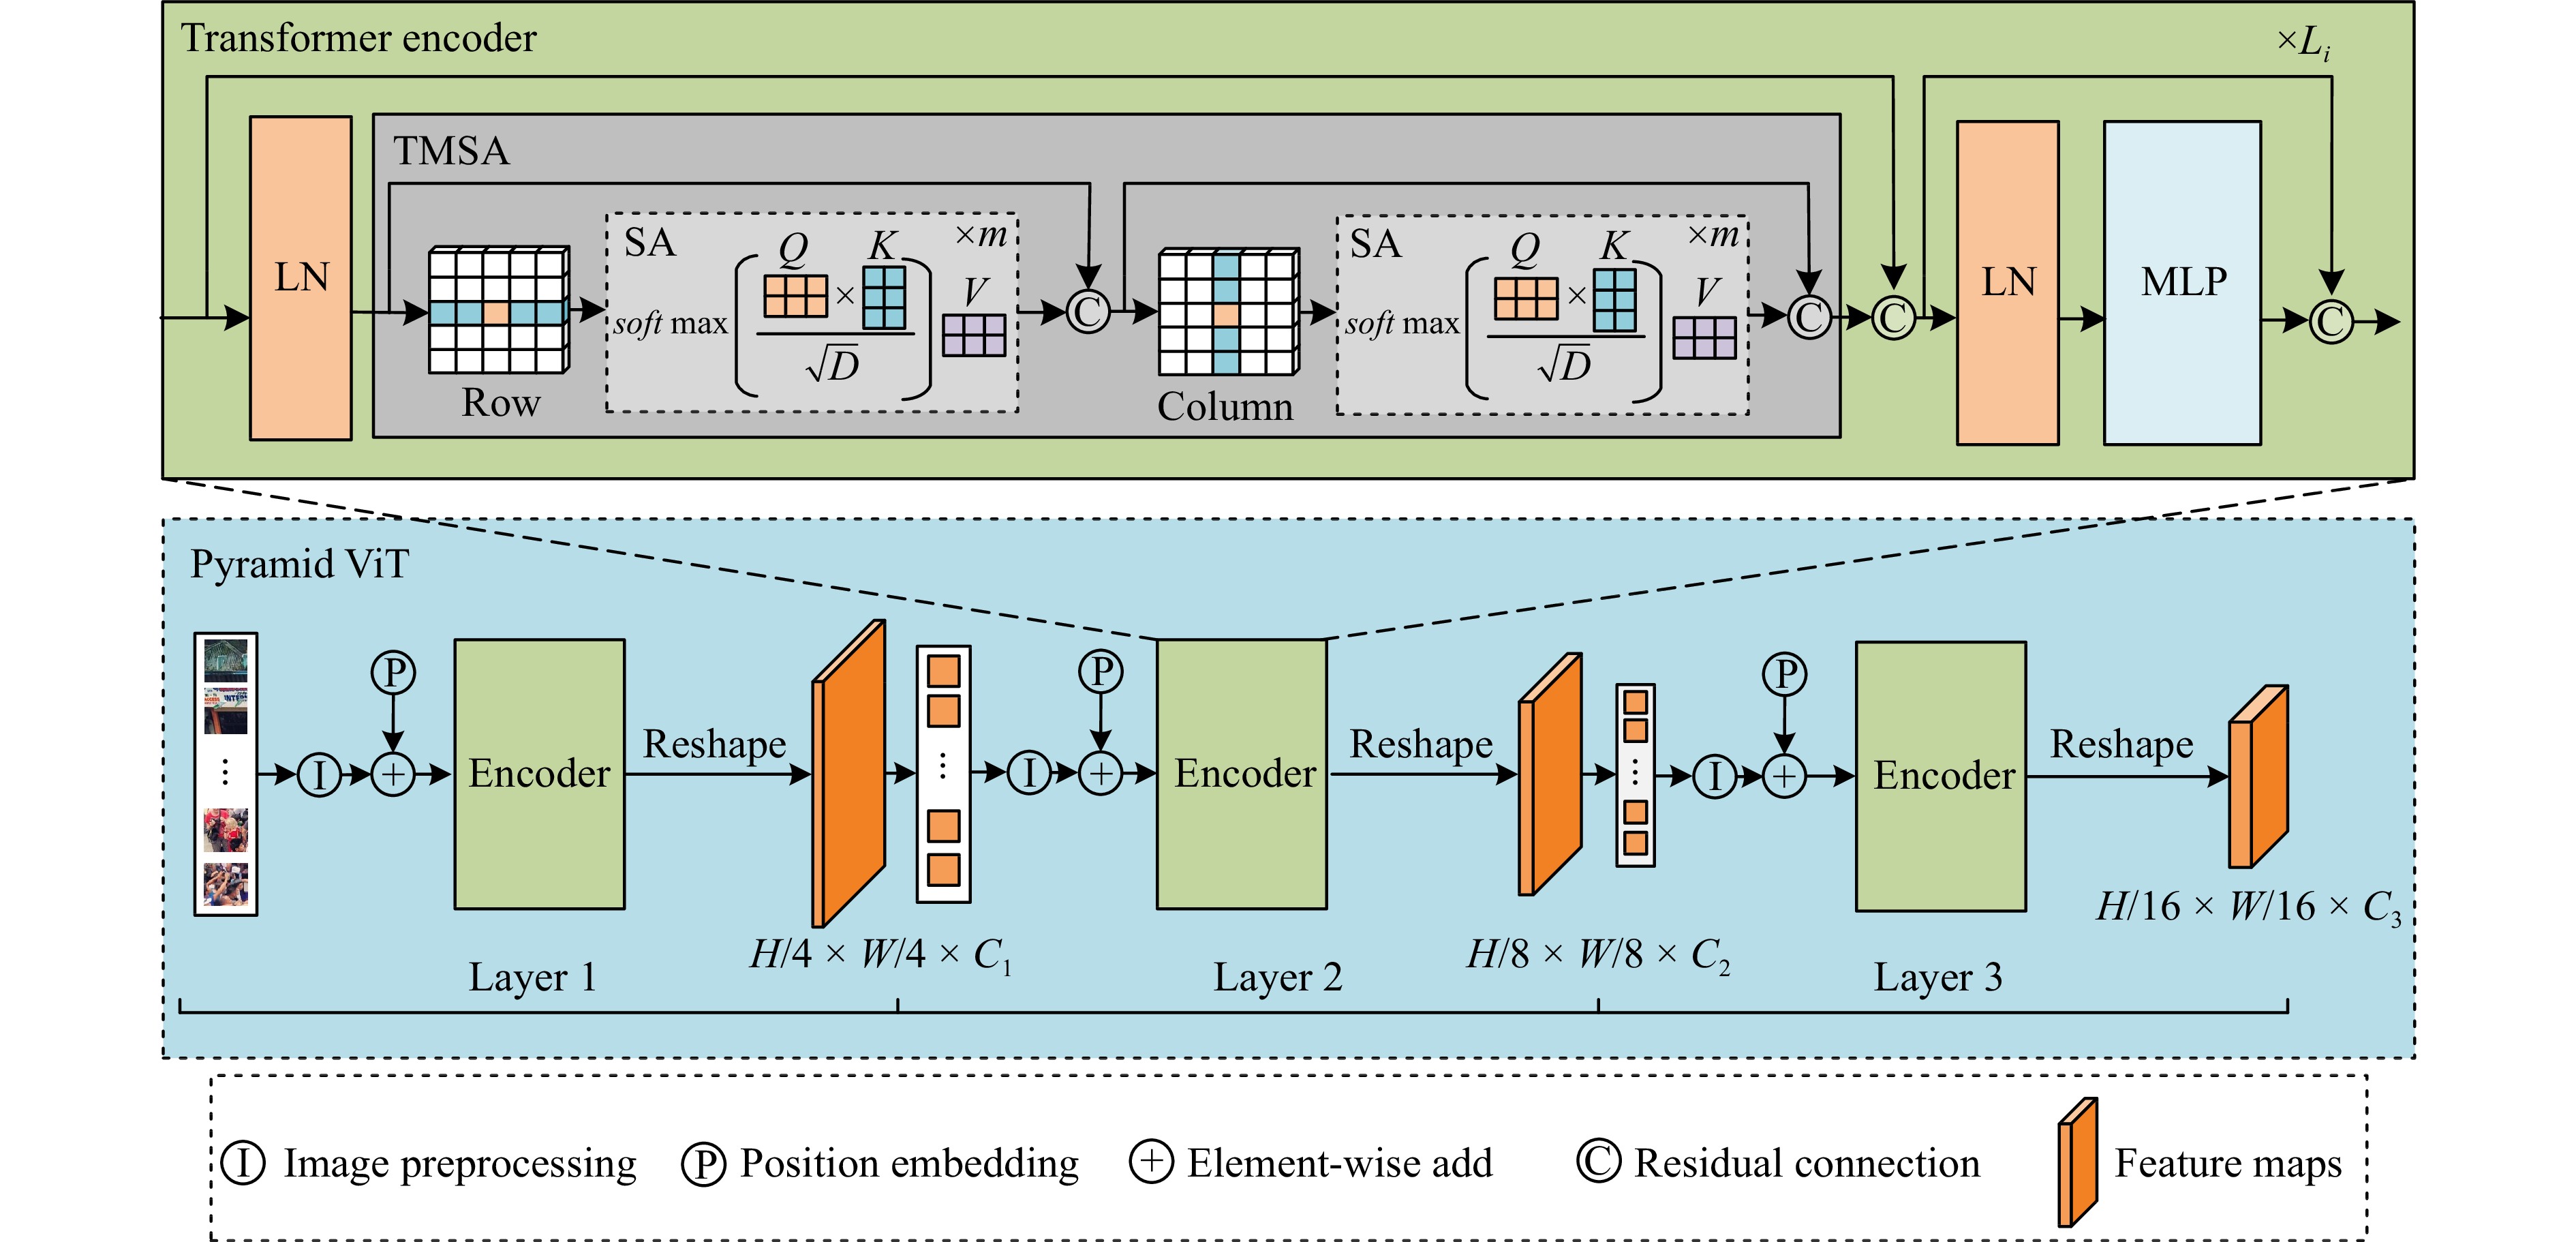
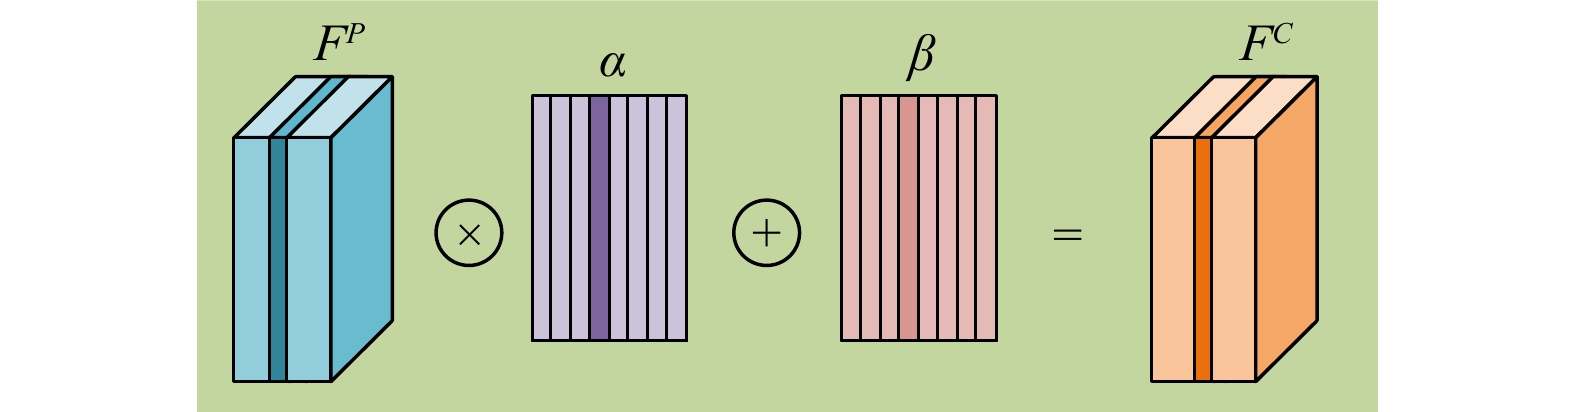
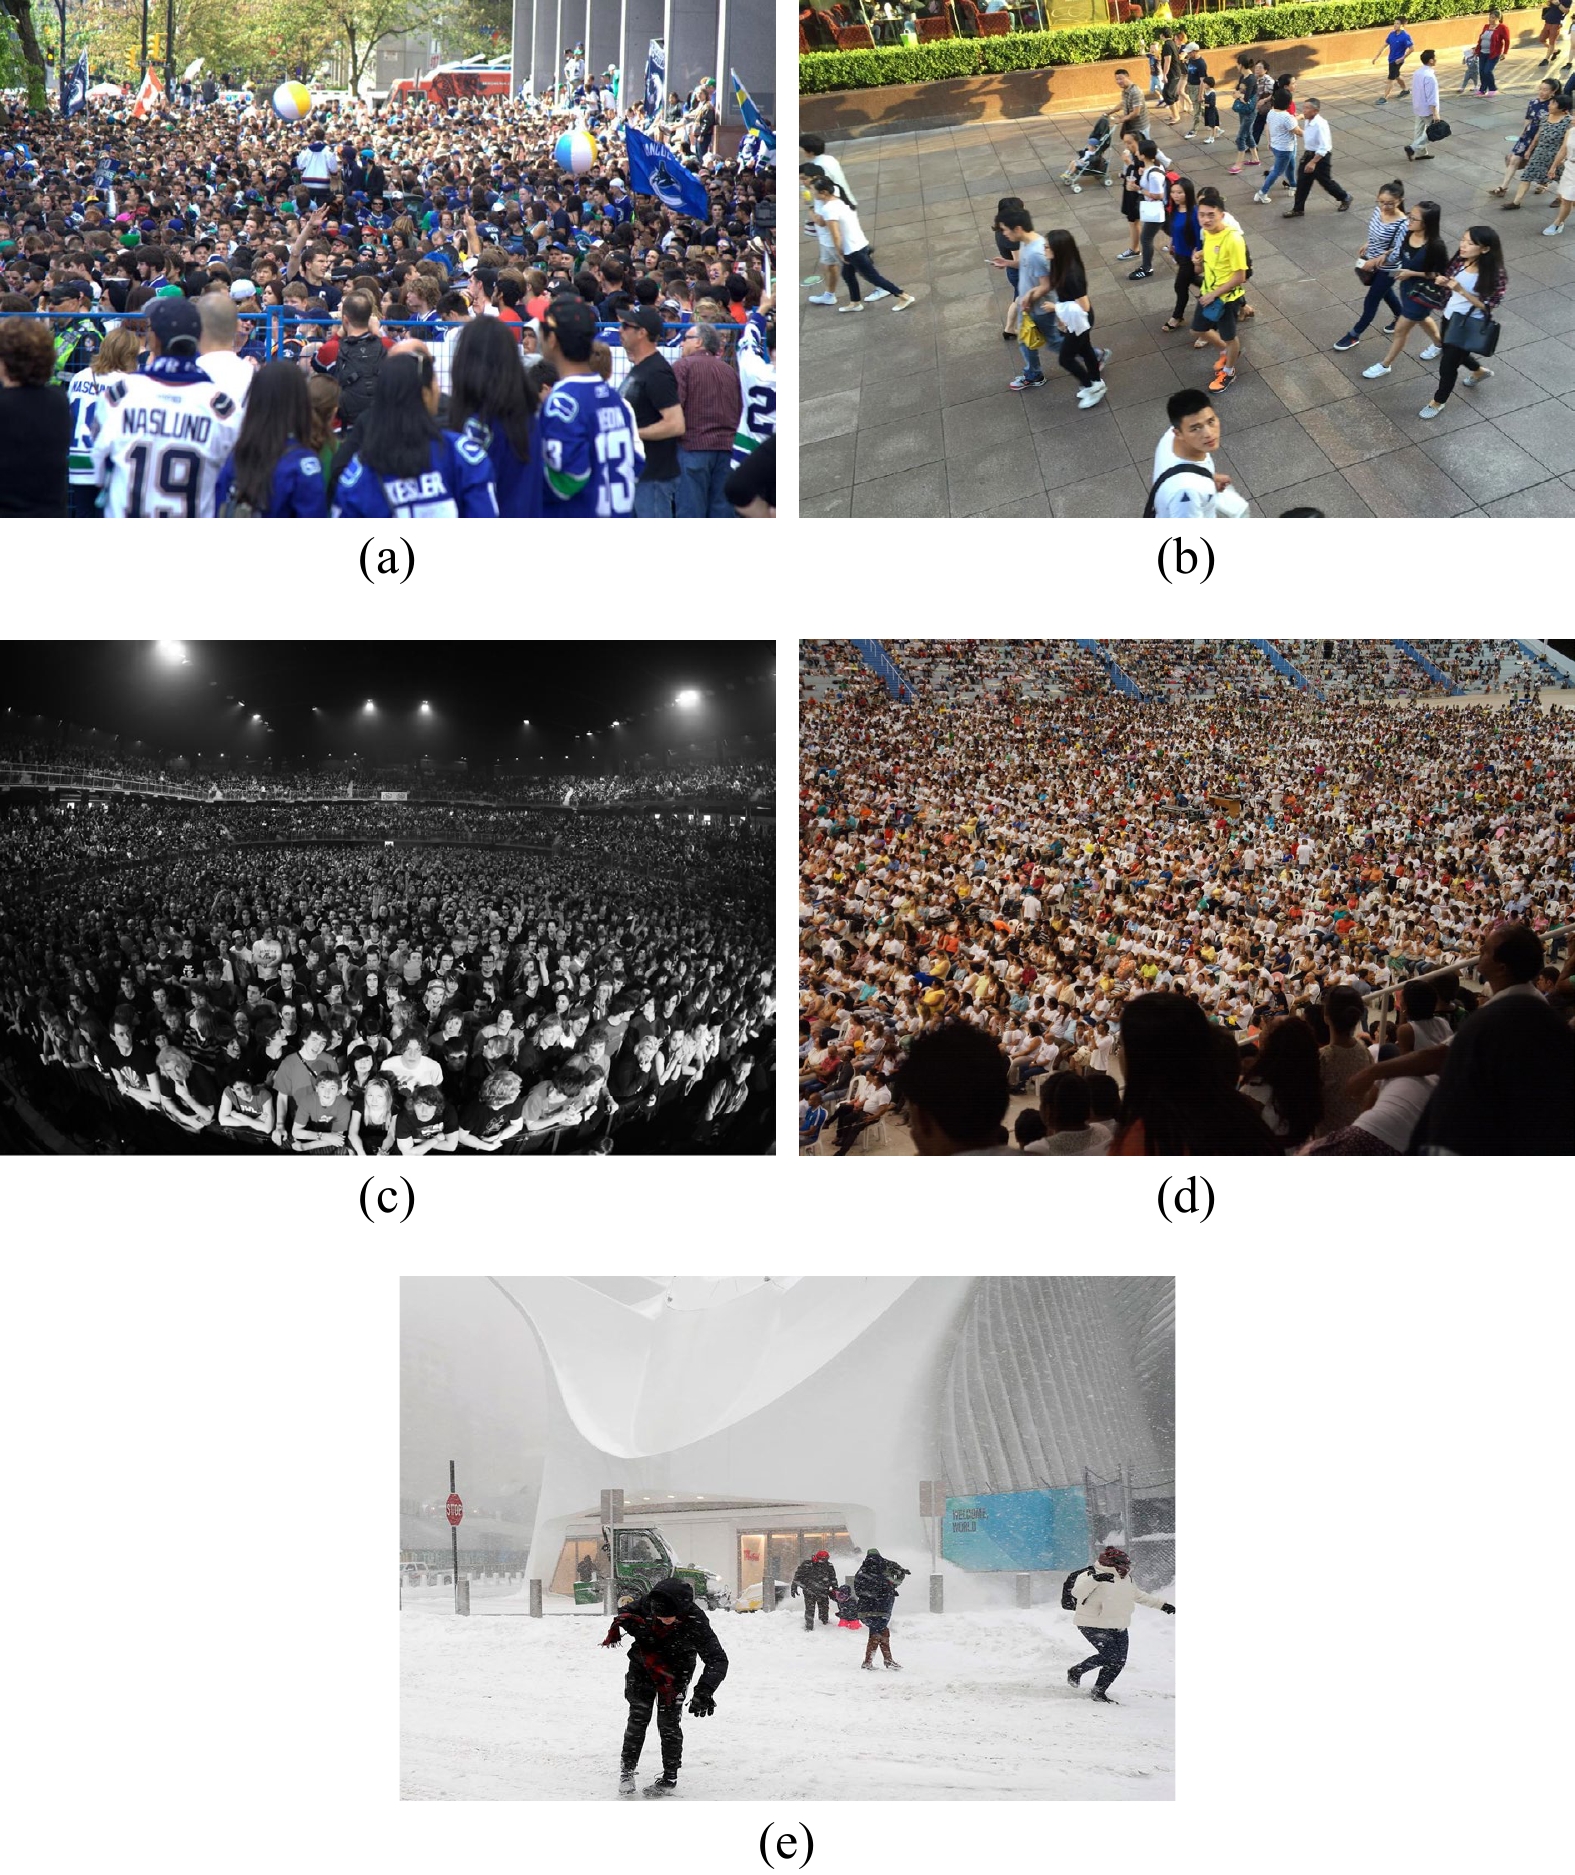
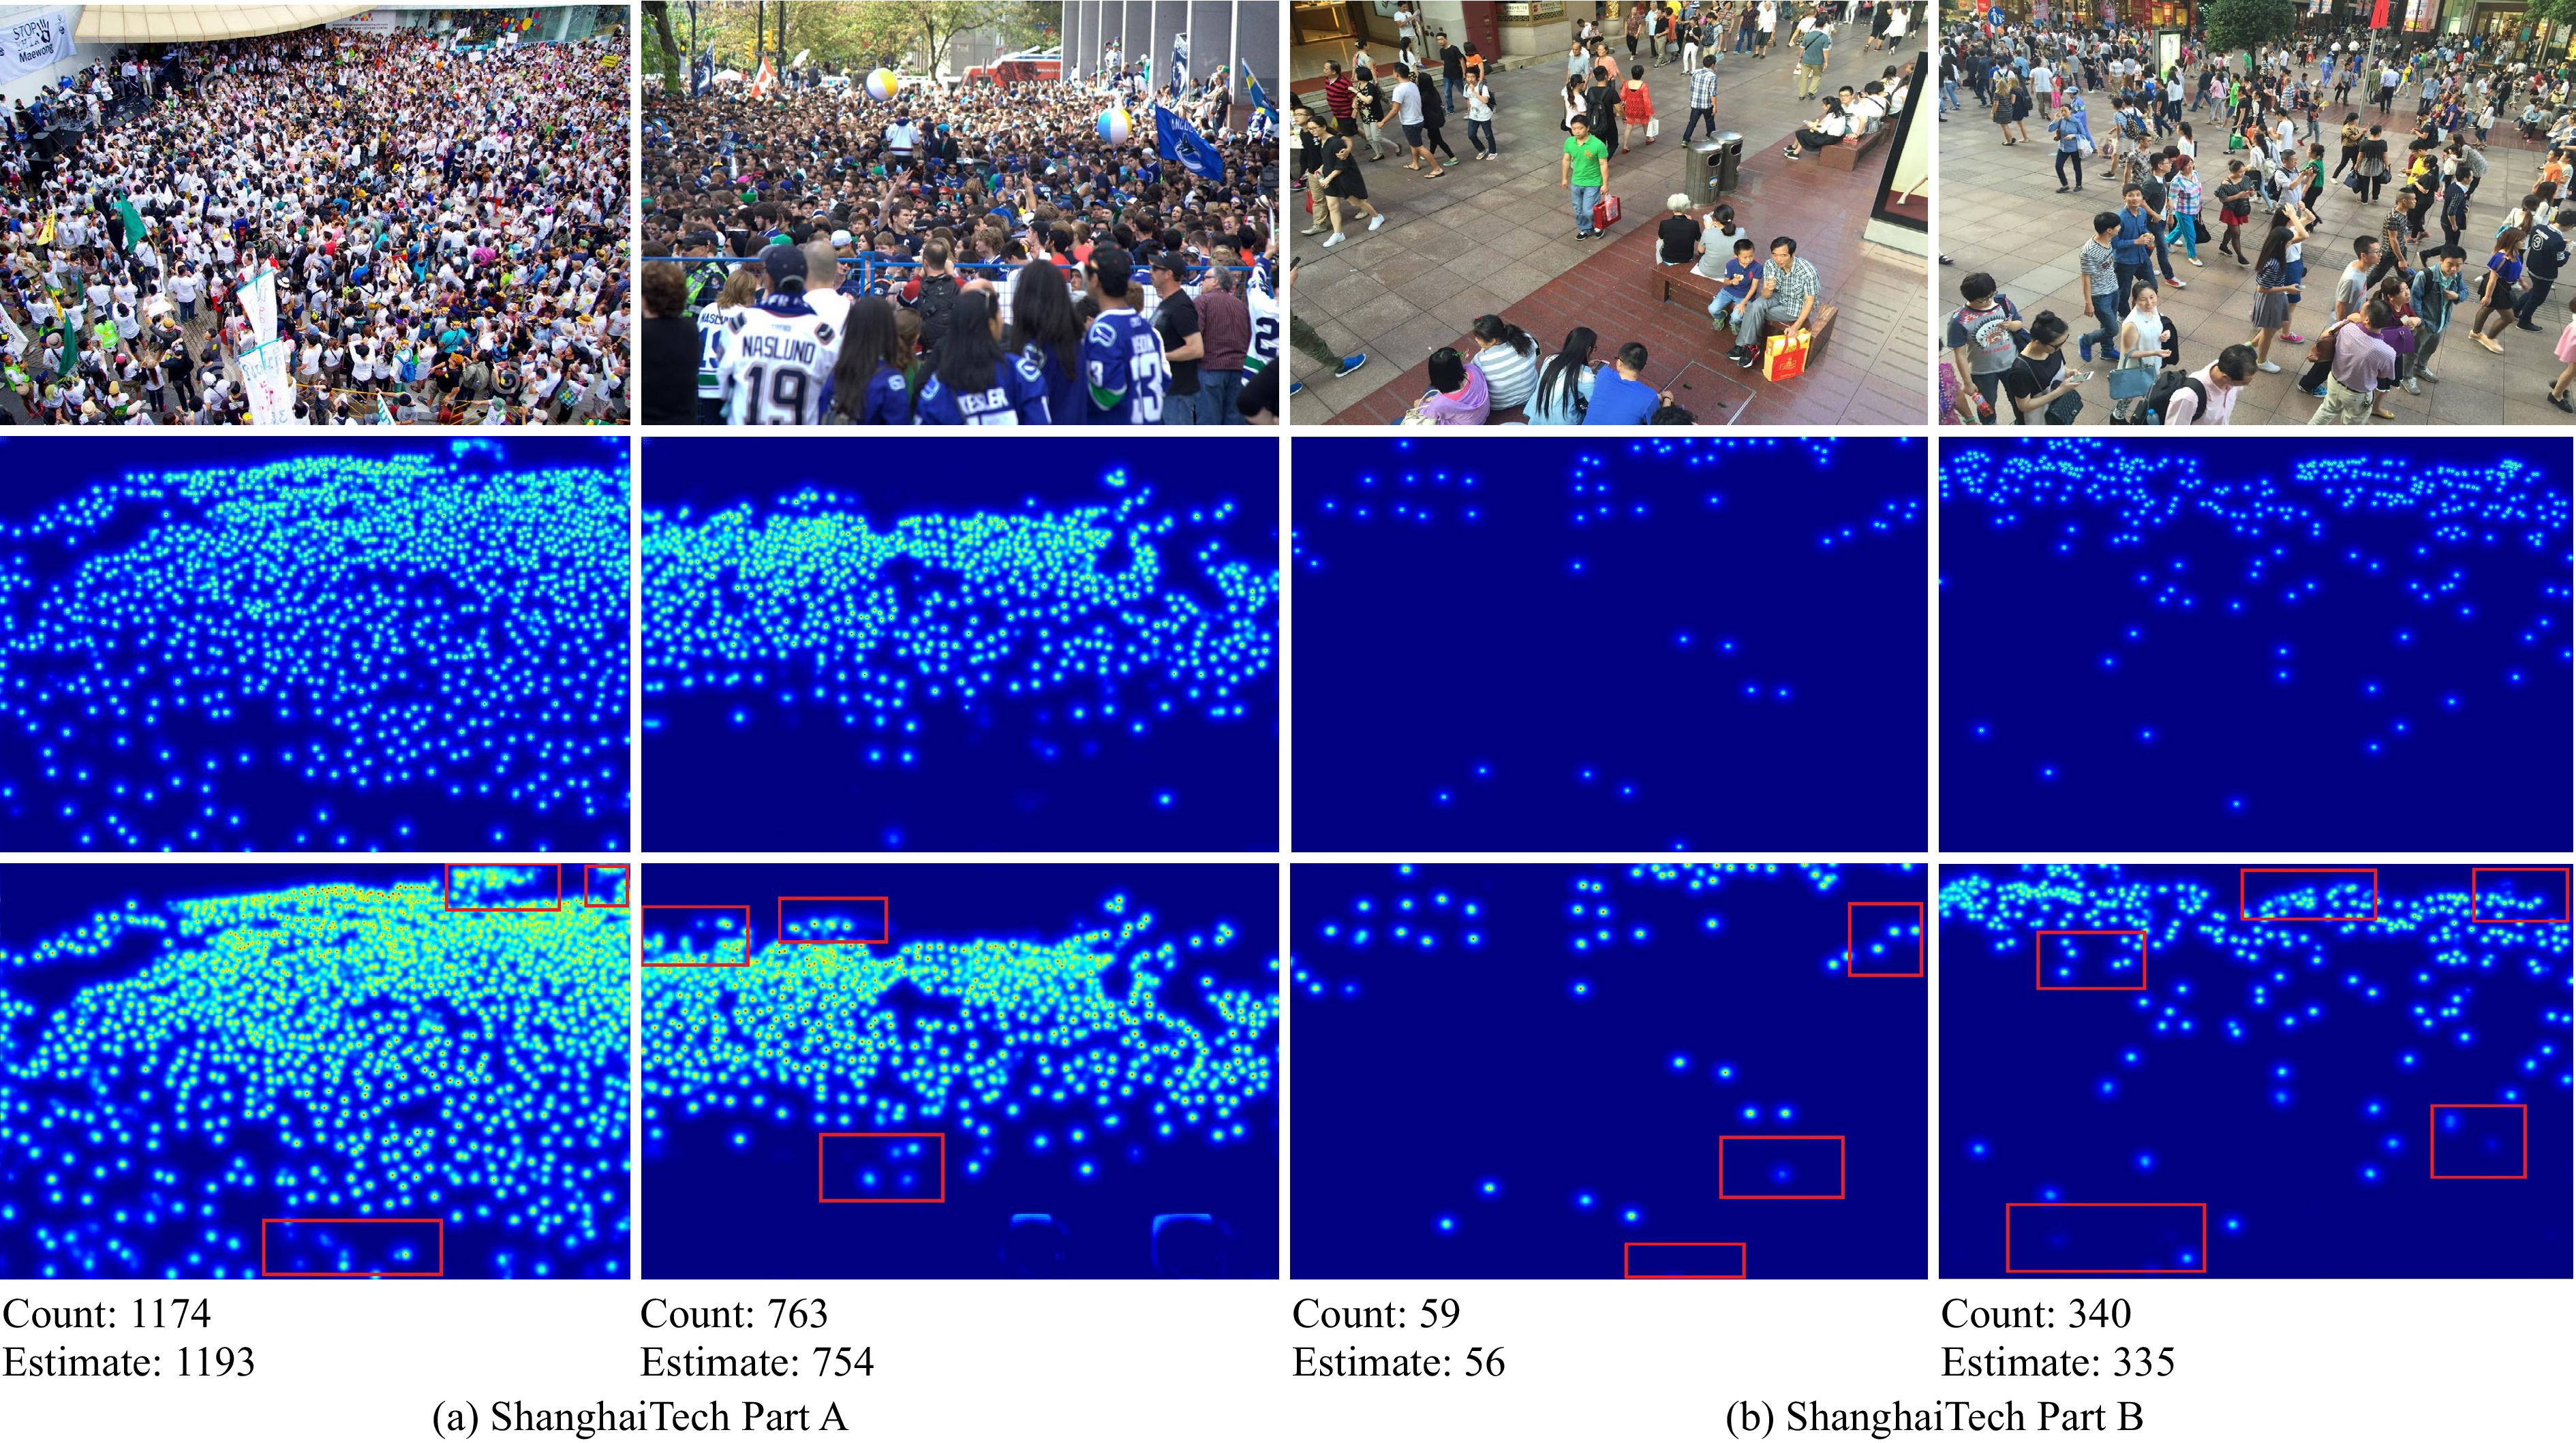
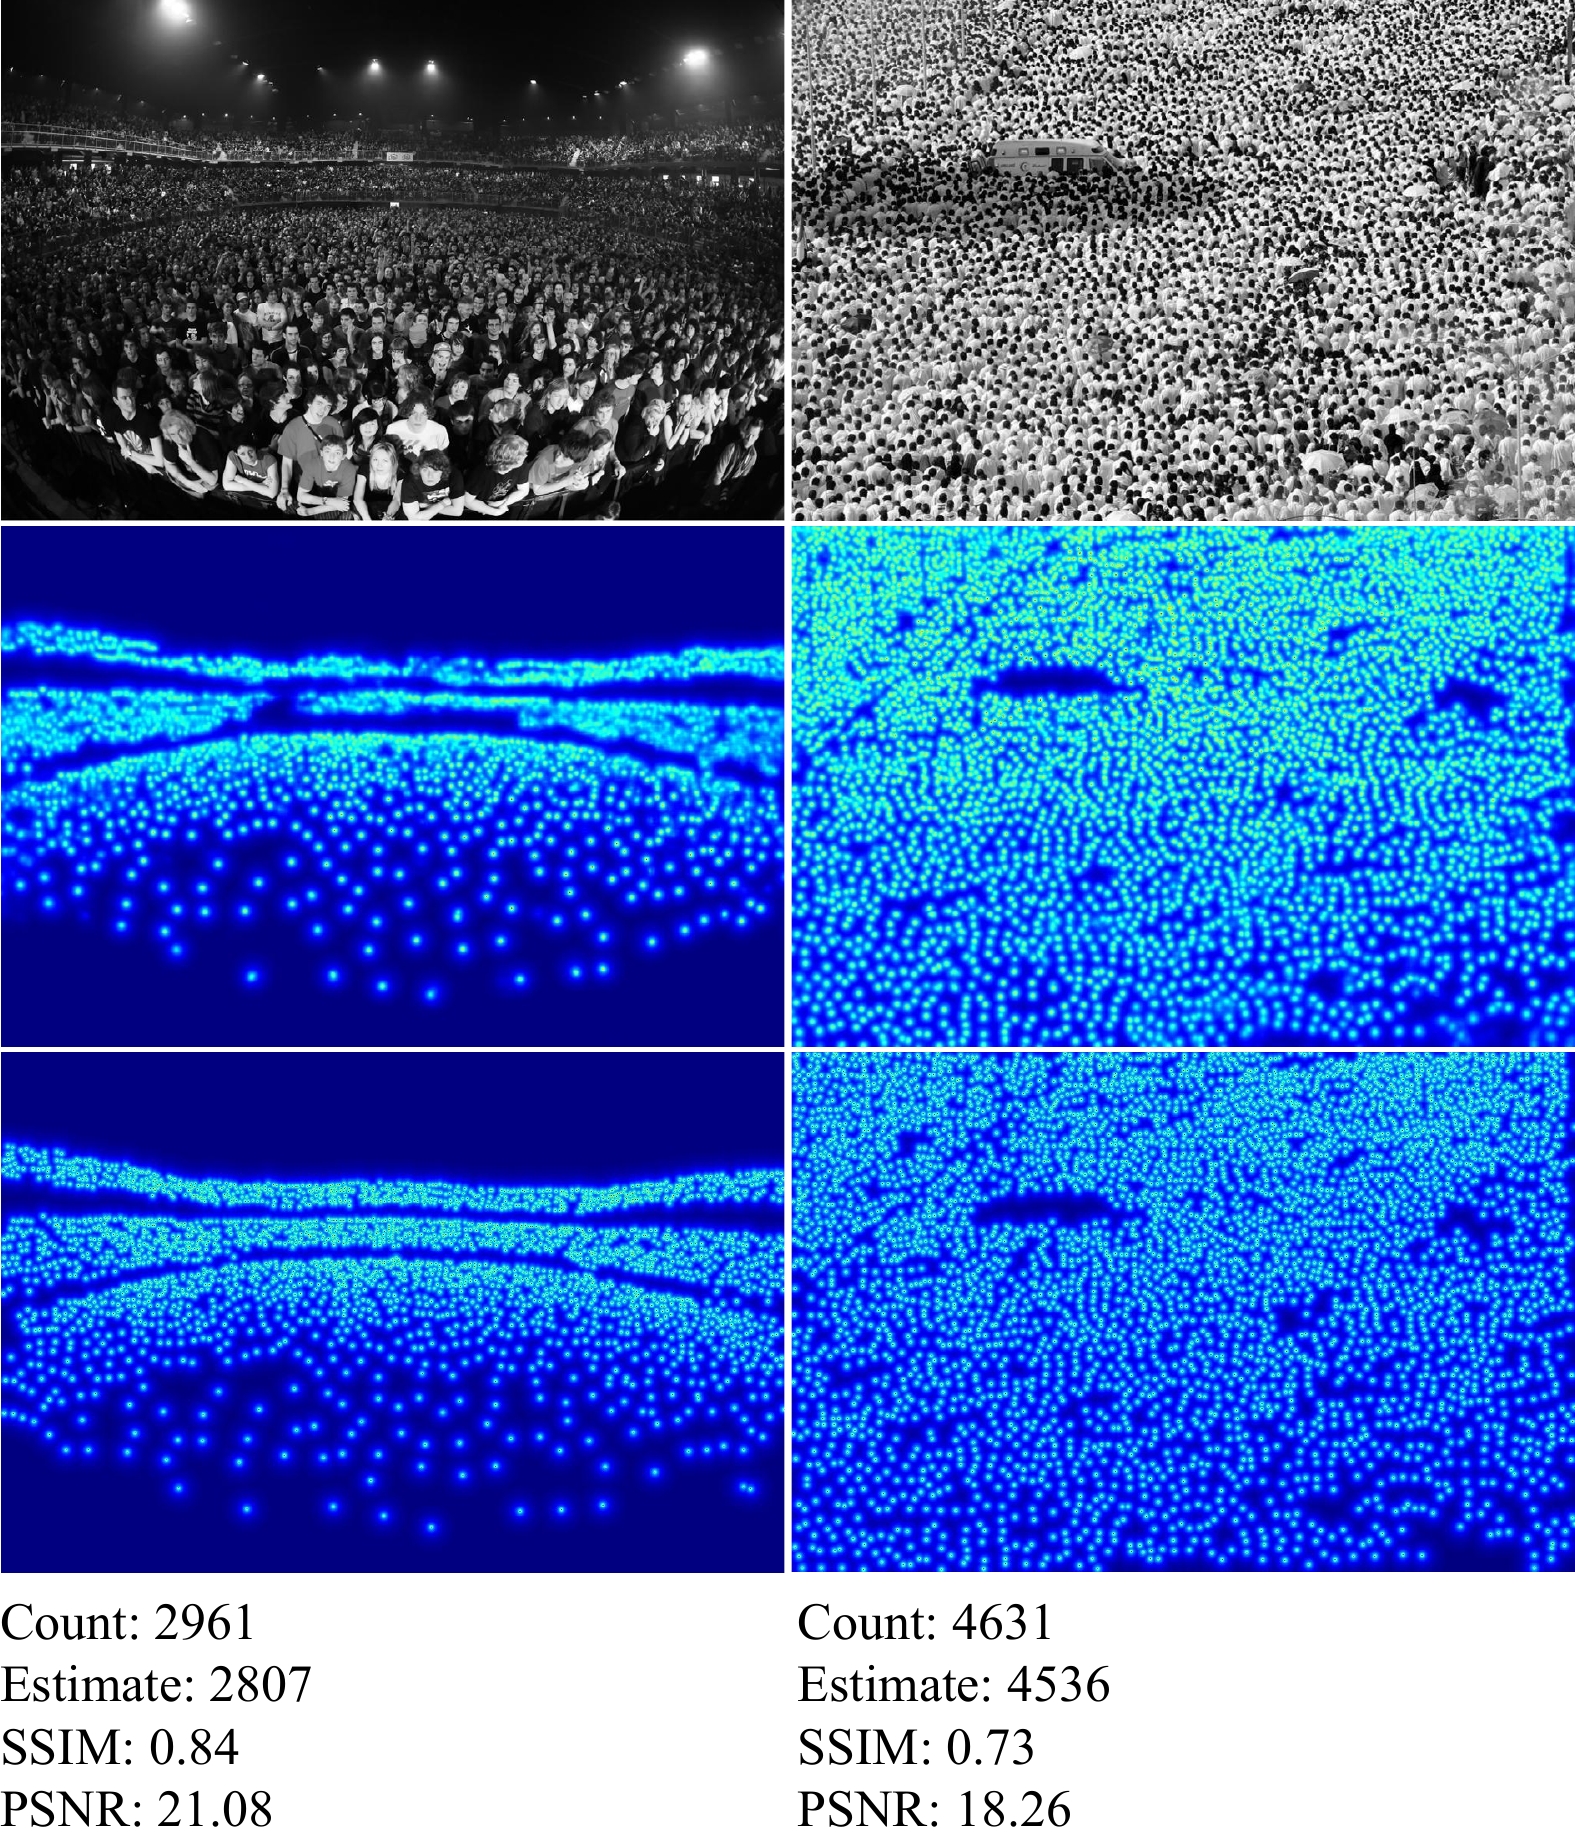
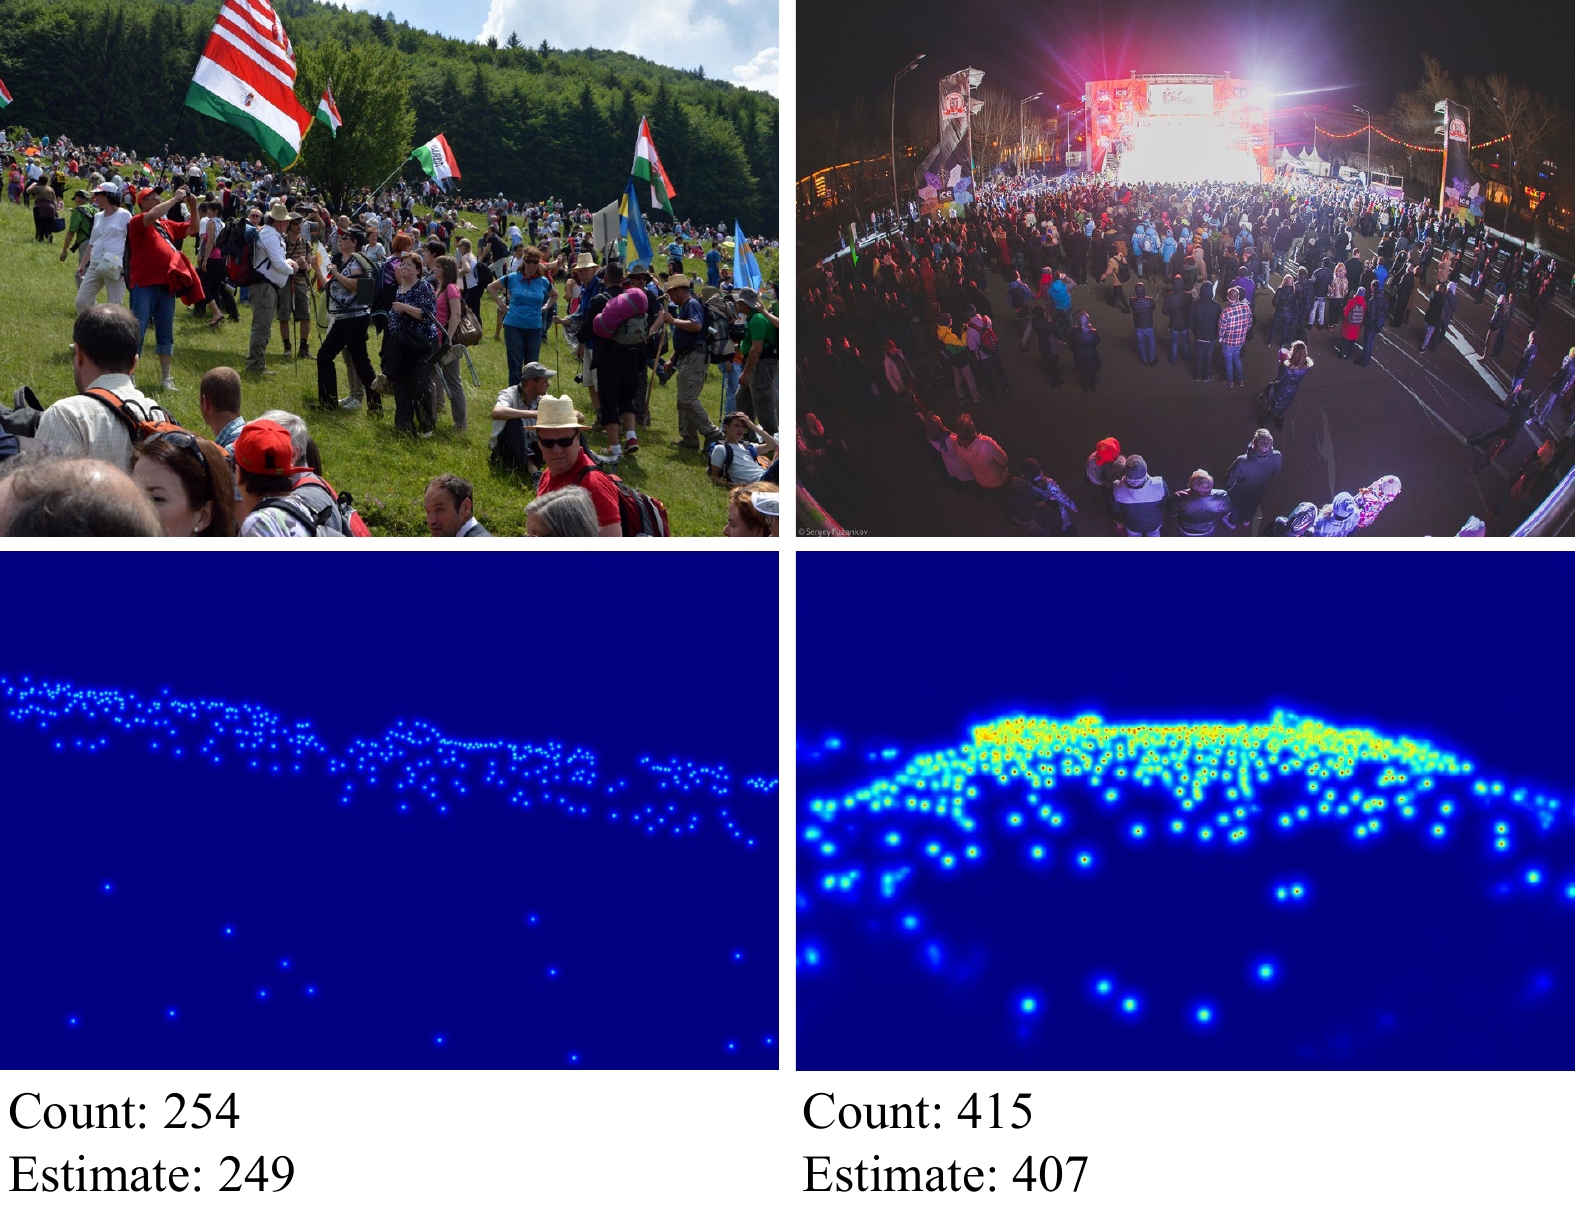
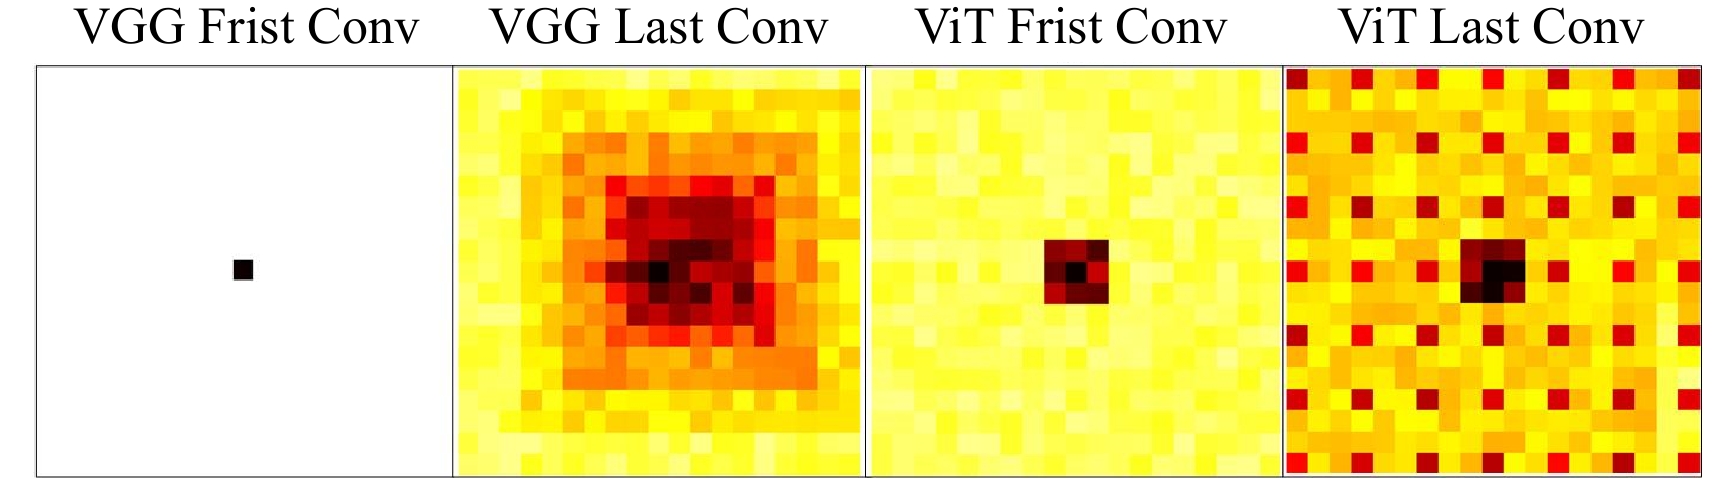
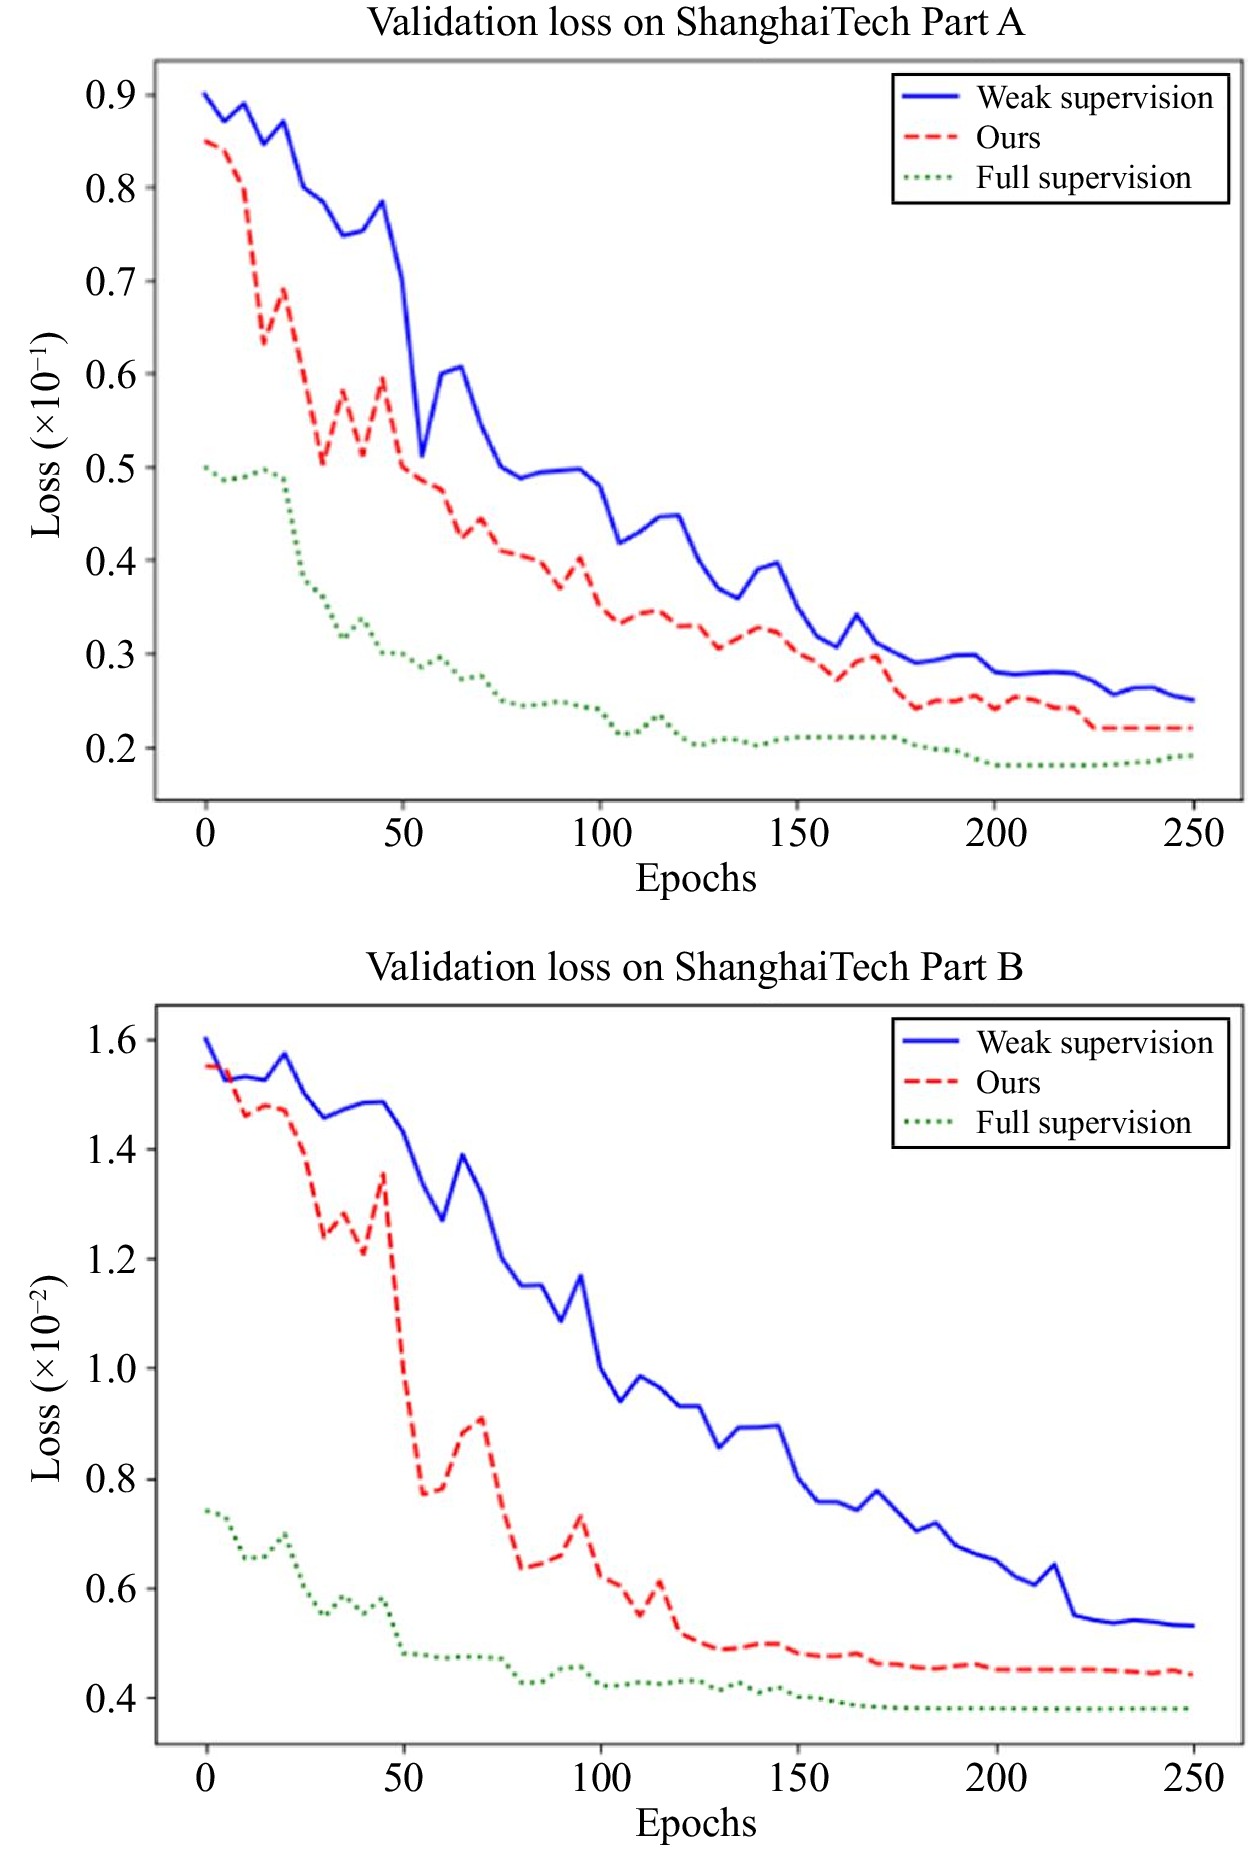
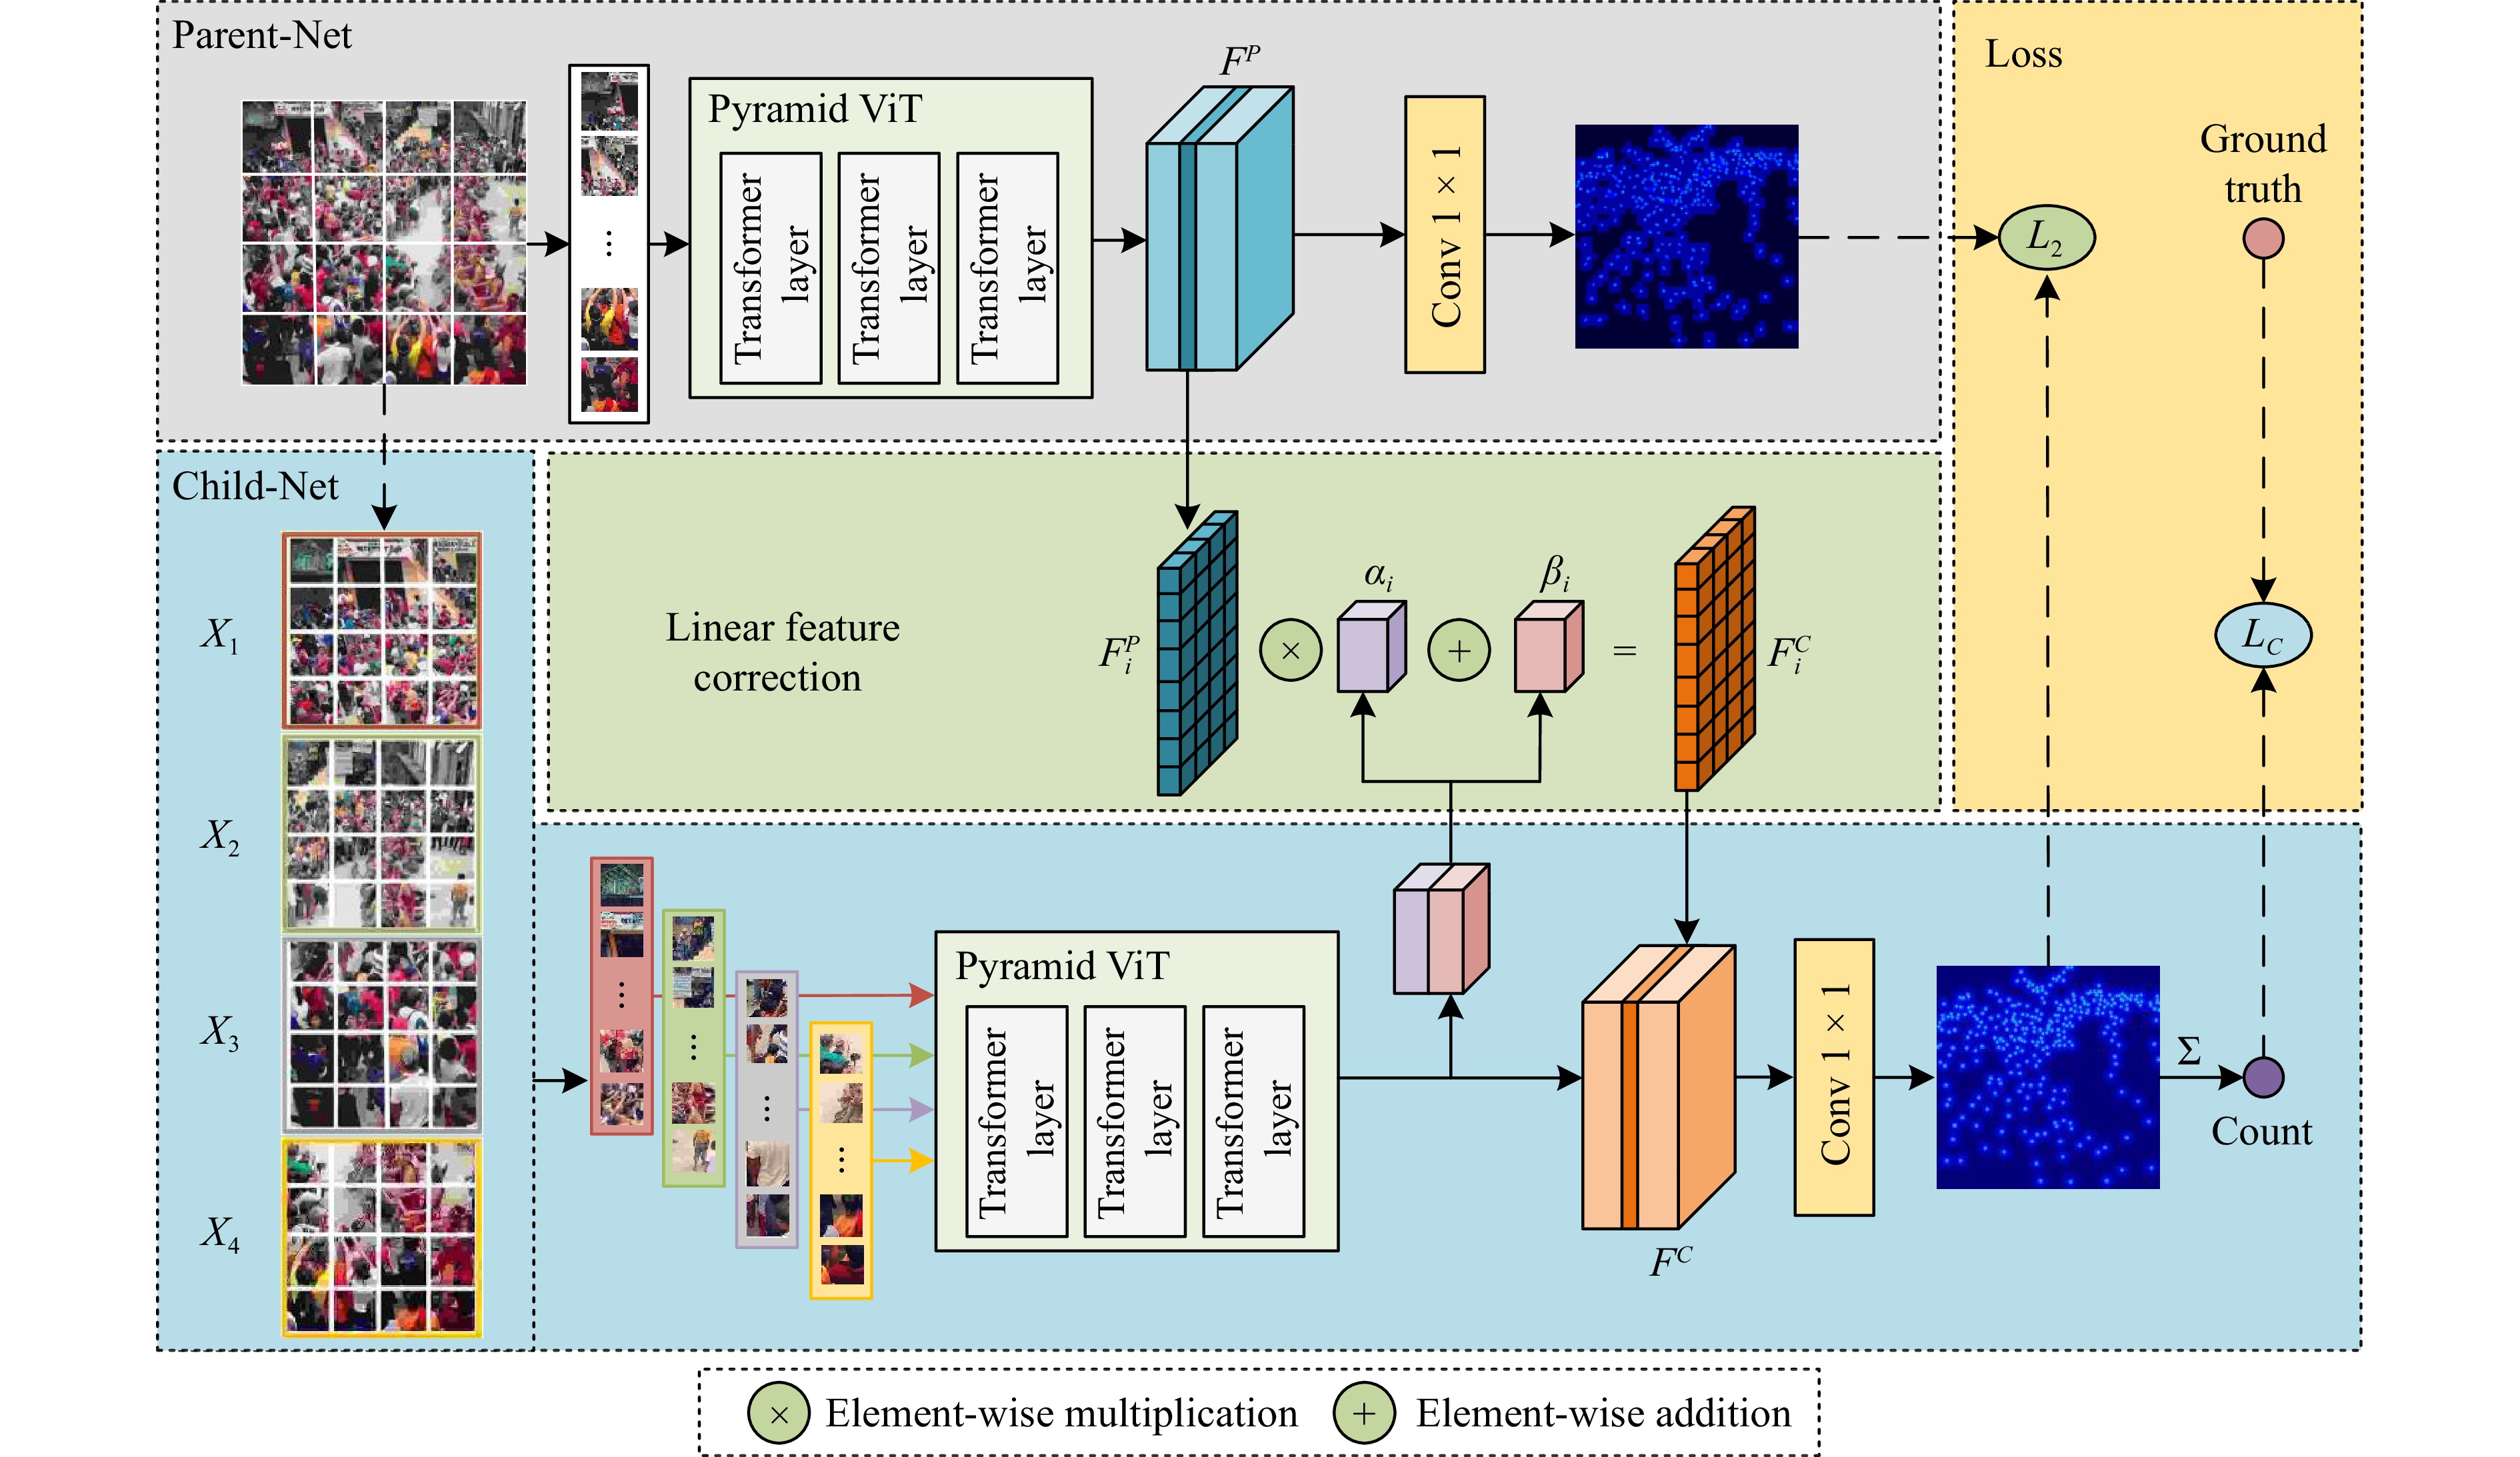
  • In a crowd density estimation dataset, the annotation of crowd locations is an extremely laborious task, and they are not taken into the evaluation metrics. In this paper, we aim to reduce the annotation cost of crowd datasets, and propose a crowd density estimation method based on weakly-supervised learning, in the absence of crowd position supervision information, which directly reduces the number of crowds by using the number of pedestrians in the image as the supervised information. For this purpose, we design a new training method, which exploits the correlation between global and local image features by incremental learning to train the network. Specifically, we design a parent-child network (PC-Net) focusing on the global and local image respectively, and propose a linear feature calibration structure to train the PC-Net simultaneously, and the child network learns feature transfer factors and feature bias weights, and uses the transfer factors and bias weights to linearly feature calibrate the features extracted from the Parent network, to improve the convergence of the network by using local features hidden in the crowd images. In addition, we use the pyramid vision transformer as the backbone of the PC-Net to extract crowd features at different levels, and design a global-local feature loss function (L2). We combine it with a crowd counting loss (LC) to enhance the sensitivity of the network to crowd features during the training process, which effectively improves the accuracy of crowd density estimation. The experimental results show that the PC-Net significantly reduces the gap between fully-supervised and weakly-supervised crowd density estimation, and outperforms the comparison methods on five datasets of ShanghaiTech Part A, ShanghaiTech Part B, UCF_CC_50, UCF_QNRF and JHU-CROWD++.


  • WITH the increase of the global population and human social activities, large crowds often gather in public places, which brings huge hidden dangers to public safety. Therefore, determining how to accurately estimate crowd density has become an important research topic in the field of public safety. To train a robust and reliable network for accurate crowd density estimation, most existing crowd density estimation networks use a fully-supervised or semi-supervised training method, the network model is trained through the ground truth generated by manual annotation, which requires a lot of manpower, material and financial resources, and in large-scale dense crowd images, interference factors such as low resolution, object occlusion, and scale changes make it difficult to label each pedestrian in the crowd. Therefore, determining how to trade off the accuracy of crowd density estimation and dataset labeling cost, and save the dataset labeling cost without losing counting accuracy becomes a challenge.

    The crowd density estimation method mainly obtains the number of crowds by extracting crowd information from the image. Existing crowd density estimation training methods mainly include fully-supervised methods [1]-[25] and semi-supervised methods [26]-[39]. The fully-supervised method is to obtain the ground truth by manually labeling each pedestrian in the image, and then training the network model through the ground truth, although this method shows high performance in crowd density estimation, it requires significant manpower, material and financial resources to label people in the image; the ground truth for the semi-supervised method is mainly divided into two types, that is, we mark all pedestrians in some images and mark some pedestrians in all images; this method is close to the fully-supervised method in crowd density estimation and shows good robustness, but this method still needs to label crowds in the image, and the training process is very cumbersome. Moreover, the problem faced by both fully-supervised and semi supervised methods is the limitation of the dataset. Then, the method for obtaining the distribution of the crowd changes, such with a change in the shooting perspective or the spatial distribution characteristics of the crowd, the ground truth obtained under the current labeling method, needs to be re-labeled, and the labeled ground truth will not be used to evaluate the counting performance during the test process. This means that the ground truth labeled for each pedestrian is redundant. To reduce the cost of manual labeling, weakly-supervised training methods are proposed, and the main difference between these methods and the fully-supervised and semi-supervised methods are that the weakly-supervised methods do not require any manual annotation of the crowd location information at all, while the fully-supervised and semi-supervised methods require manual annotation of all or part of the crowd location information. In fact, without the demand for locations, the crowd numbers can be obtained in other economical ways. For instance, with an already collected dataset, the crowd numbers can be obtained by gathering the environmental information, e.g., detection of disturbances in spaces, or estimation of the number of moving crowds. Chan et al. [40] segment the scene by crowd motions and estimate the crowd number by calculating the area of the segmented regions. To collect a novel counting dataset, we can employ sensor technology to obtain the crowd number in constrained scenes, such as mobile crowd sensing technology [41]. Moreover, Sheng et al. [42] propose a GPS-less energy-efficient sensing scheduling to acquire the crowd number more economically. On the other hand, several approaches [43]-[46] prove that, with the estimated results, there is no tight bond between the crowd number and the location. The weakly-supervised labeling data in this paper, all of which were obtained from already collected datasets, use only the crowd’s quantity labeling and drop the location labeling information.

    However, although such weakly-supervised methods save the cost of dataset labeling, the ensuing problem is that the network does not know the characteristics of pedestrians at the beginning of the training process, due to the lack of the location information of the crowd as the training label, and the characteristics of pedestrians are learned only after several iterations, which leads to reduced sensitivity of the network to crowd features, and the convergence speed of the network becomes very slow, and the network model’s ability to fit features is substantially reduced, which affects the accuracy of crowd density estimation. Therefore, the weakly-supervised approach of simply removing the crowd location information saves the cost of labeling the dataset, but limits the performance of the network and does not fundamentally solve the problem.

    To solve the above problem, inspired by the optimal iterative learning control methods [47]-[49], reaction–diffusion neural networks [50] and the model latent factor analysis [51]-[54], we reconsider the training approach of the crowd density estimation model and also sample weakly-supervised data labels, i.e., we use only the number of pedestrians in the image as supervised. However, to compensate for the missing crowd location information and to improve the convergence speed of the network and the feature fitting ability, we designed a novel and effective training method, using a parent-child network with the same parameters to learn different features in the crowd, and then using a linear transformation to correct the information location of the features extracted by the parent network using hidden features learned by the child network, to accelerate the network’s ability to adapt to the features. Our training method, significantly improves the convergence speed of the network; the network performance as well as the counting accuracy, is not much different from the fully-supervised method, and, since the parent network has the same parameters as the child network, the increment of the number of parameters of the parent-child network model is very small compared to the number of parameters of the parent network, and the increase in the number of parameters is well within the acceptable range compared to the improved performance of the network. To address the above problems, this paper designs a crowd density estimation method based weakly-supervised learning, which trains the network by correlating between global and local image features to improve the performance of the network model. The main contributions of this paper are as follows:

    1) We design a weakly-supervised crowd density estimation method, which based on using only the number of crowd as supervised information without using location label supervision. It omits the manual labeling work without losing the crowd density estimation performance and greatly saves the cost of network training compared to existing fully-supervised methods.

    2) We design a novel and effective training approach by designing a parent-child network, which uses incremental learning, by the characteristic linear calibration structure to enhance the adaptability of the network to hidden features using transfer factors and offset weights. It improves the performance of weakly-supervised learning methods, and we verify its effectiveness in this task.

    3) We design a loss function that adds the error between the parent network features and child network features (L2) to the ground truth and predicted counting error (LC), and use gradient descent to optimize the features extracted by the parent-child network to accelerate the convergence speed of network training and improve the accuracy of crowd density estimation.

    1) Fully-Supervised/Semi-Supervised Crowd Density Estimation Methods: With the development of big data, machine learning, and convolutional neural networks [55]-[61], a large number of convolutional neural network (CNN)-based crowd density estimation methods have been proposed. Basic CNN is first applied to crowd density estimation, such as CNN-boosting [1], Wang et al. [2], these networks use basic CNN layers, including convolutional layer, pooling layer, fully connected layer, no additional feature information is required, which are simple and easy to implement, but the crowd estimation accuracy is low. Multi-column CNN is subsequently widely used, such as MCNN [3], MBTTBF [4], Multi-scale-CNN [5], CP-CNN [6], DADNet [7], these networks usually use different columns to capture multi-scale information. However the information captured by different columns is redundant and wastes many training resources. To solve the problem of redundant feature extraction by multi-column CNN, Single-column CNN is applied to crowd density estimation, such as CSRNet [8], SANet [9], SPN [10], CMSM [11], TEDnet [12], and IA-MFFCN [13]. These networks usually deploy a single deeper CNN instead of the bloated structure of multi-column network architecture, do not increase the complexity of the network, and have higher training efficiency, so it has received extensive attention. However, with the development of the density map-based method, the background noise in the image seriously affects the display of the detailed information of the crowd distribution, how to filter out the background noise to highlight the crowd location information has become a challenge.

    Therefore, attentional mechanisms have been widely introduced into crowd density estimation tasks, and, attentional mechanisms can supplement the features extracted by the backbone network or the head network by providing the capability to encode distant dependencies or heterogeneous interactions to highlight the head position. ADcrowdNetp designs an attention image generation structure [14], attentional neural field (ANF) uses local and global self-attention to capture long-range dependencies [15], attention guided feature pyramid network (AP-FPN) proposes an attention guided feature pyramid network [16], which adaptively combines high-level and low-level features to generate high-quality density maps with accurate spatial location information, and multi-scale feature pyramid network (MFP-Net) designs a feature pyramid fusion module using different depth and scale convolution kernels [17] where the receptive field of CNN is expanded to improve the training speed of the network, PDANet uses a feature pyramid to extract crowd features of different scales to improve counting accuracy [18], and SPN uses the scale pyramid network to effectively capture multi-scale crowd characteristics [10], and obtain more comprehensive crowd characteristic information. Meanwhile, researchers have attempted to transfer Transformer models in the field of natural language processing to the task of crowd density estimation [19]-[23], [62]-[66]. Transformer uses self-attention to capture the global dependency between input and output, where the advantage is that it is not limited by local interactions, can mine long-distance dependencies and can perform parallel calculations, where the most appropriate inductive bias can be learned according to different task objectives, thereby capturing the global context information of the image and modeling the dependencies between global features, which is a good solution to the limited receptive field of CNN, especially in the presence of uneven scales in dense crowds. In 2020, Dosovitskiy et al. [19] proposed the vision transformer (ViT) model, an image classification method based entirely on the self-attention mechanism, which is also the first work of Transformer to replace convolution. In 2021, Sun et al. [24] demonstrated the importance of global contextual information in the task of crowd density estimation. In 2021, TDCrowd combines ViT and density map to estimate the number of people in the crowd [25], which solves the problem of background noise interference in crowd density estimation, and improves the accuracy of crowd density estimation.

    However, the aforementioned CNN or ViT methods require a large number of labels for training, and labeling the crowd density estimation dataset is a laborious task.

    2) Weakly-Supervised Crowd Density Estimation Methods: To reduce the cost of labeling the dataset, some weakly-supervised crowd density estimation methods have been developed. In the weakly-supervised methods, there is no need to label any crowd location information, and image-level count labels are used as the weakly-supervised signal for training. In 2016, Borstel et al. [37] proposed a weakly-supervised density estimation method based on the Gaussian process, using the number of objects as the label to train the network, but this method partitions the image, so that different partitions will repeat the same target, causing the estimated number of targets to be higher than the actual number. In 2019, Ma et al. [38] proposed a weakly-supervised density estimation method using Bayesian loss, which performs expectation calculation from the probability density map estimated from the network, and regresses to estimate the number of people in the crowd, which improves the counting efficiency under the weakly-supervised method. In 2019, Sam et al. [36], designed an auto-encoder to train the network in a weakly-supervised way, updating only a small number of parameters during training, in an attempt to achieve a nearly un-supervised method for crowd density estimation. In 2020, Yang et al. [39], proposed a network based on soft label ranking, which highlights the supervision of crowd size based on the original crowd density estimation network. In 2020, Sam et al. [29], by matching statistics of the distribution of labels, proposed a weakly-supervised training method that does not use image-level location labeling information. To ease the overfitting problem, in 2019, Wang et al. [27] explores the generation of synthetic crowd images to reduce the burden of annotation and alleviate overfitting. With the application of ViT in the field of crowd density estimation, in 2021, TransCrowd applied ViT to crowd density estimation for the first time [21], and proposed a weakly-supervised counting method, which greatly improved the accuracy of crowd density estimation in the weakly-supervised mode, but was affected by the simple structure of the model, where extraction of features was limited.

    Compared with previous weakly-supervised methods, we proposed a weakly-supervised method based on linear calibration of parent-child network features, which can effectively reduce labeling cost during training, while maintaining state-of-the-art performance, achieving an optimal trade-off between crowd density estimation accuracy and dataset labeling cost.

    To improve the convergence speed of the network under the weakly-supervised training method, we propose a parent-child network (PC-Net). It exploits the correlation between global and local features in images to enhance the network’s ability to fit the features by incrementally learning and continuously linearly correcting the features extracted by the network. The proposed PC-Net structure is shown in Fig. 1. The PC-Net achieves a better balance between accuracy and training costs. Specifically, PC-Net is divided into two parts, the Parent network and Child network, which have the same backbone network. We design a pyramid vision transformer as the feature extraction backbone network to extract crowd features at different levels. In the process of network training, the Parent network learns crowd features through global images, while the Child network learns feature transfer factors and feature bias weights from local images. Then, the crowd features learned by the Parent network are corrected by a linear correction structure to obtain a feature map that contains richer and more accurate global contextual information. Meanwhile, during the training of the network, the Parent and Child networks are updated with the learned weights by gradient descent using different losses to improve the accuracy of the crowd density estimation. Finally, a 1 × 1 convolutional layer is used to output the final density map. In the following sections, we describe our framework in detail.

    Figure  1.  Overview of the proposed PC-Net architecture. First, the Parent-Net is trained with the global images. Second, learnable parameters α and β are used to corrective features, which are defined according the Parent-Net, namely, for a Parent-Net feature FPiFP (i is the index of feature channel), there are a αi and a βi that are used to generate a Child-Net feature FCiFC by the linear correction. Third, after loading the correction feature FC to the Child-Net, the partial images are feed into the Child-Net to update the correction parameters.

    In PC-Net, the subject network is divided into two parts, Parent-Net and Child-Net. In order to use incremental learning, linearly correcting the crowd features, Parent-Net and Child-Net have the same network structure. In order to adapt to the problem of scale variability existing in crowd images, a pyramid vision transformer feature extraction backbone network is designed in this paper to extract crowd features at different levels, as shown in Fig. 1, while using a multi-scale window to restrict the calculation of the vision transformer’s self-attention mechanism to non-overlapping local regions, which improves computational efficiency. Since the vision transformer can not directly process 2D images, an image preprocessing process is required to convert 2D images into 1D image block sequences before the images are input to pyramid vision transformer. The process of image preprocessing and the structure of the pyramid vision transformer are shown as follows.

    1) Image Partition

    Before the image is input into the pyramid vision transformer, the 2D image is converted into a 1D image block sequence. To improve the computational efficiency, the input image is divided into N × N fixed windows, and the image in the window is divided into image blocks of fixed size, and the self-attention calculation is performed in each window, as shown in Fig. 2.

    Figure  2.  The process of the image partition.

    Specifically, input image IRH×W×3, divide I into N×N fixed windows In, n[1,N×N], and divide I into HK×WK patches, where the size of each patch is K×K×3, and each window In contains HNK×WNK patches. Convert them into a 1D images patch sequence xnRL×D, n[1,N×N], L=HWN2K2,D=K×K×3. The location mapping of xn using a learning-based projection f:xnieni, i[1,D] translates the spatial and channel features of the ith image block in the nth window into the embedded features of the nth set of ith vectors, as follows:

    Zn0=[en1+pn1, en2+pn2 ,, enL+pnL], n[1,N×N] (1)

    where Zn0 denotes the sequence with position information input to the transformer-encoder for the nth window, eni denotes the ith image block in the nth window, pni denotes the position information of the ith image block in the nth window.

    2) Pyramid Vision Transformer

    When extracting multi-scale crowd features, a multi-layer pyramid vision transformer structure is used. Between layers, the scale of the feature map is controlled by a strategy of progressive shrinkage. Simultaneously, the scheme using multi-scale windows restricts the self-attention calculation process to non-overlapping local windows, and expands the window layer by layer through cross-window connections, which improves the computational efficiency. The method in this paper designs a three-layer transformer-encoder structure, as shown in Fig. 3.

    Figure  3.  The structure of pyramid vision transformer. The feature map of each layer needs to be partitioned first to convert the 2D image into a 1D sequence, and then perform feature reshape on the processed 1D sequence to generate 2D features.

    Specifically, the size of the input image is H × W × 3, the size of the output feature map Fi after Layer i is Hi × Wi × Ci, and the size of the image patch in Layer i is Ki × Ki × 3, where K1 = 4, K2 = 2, K3 = 2, the number of Layer i windows is Ni × Ni, where N1 = 4, N2 = 2, N3 = 1, each window of Layer i contains Hi1Wi1(KiNi)2 images patch, and linearly project the image patch into a 1D sequence and embed position information, after the transformer-encoder extracts features, visualize feature sequence rearrangement as feature maps, where Ci is less than Ci−1. The transformer-encoder of Layer i includes Li layers twin multi-head attention mechanism (TMSA) and multi-layer perceptron (MLP), where L1 = 2, L2 = 6, L3 = 2, and each layer is processed by layer normalization (LN) and residual connection. Before TMSA and MLP, LN is used to normalize the feature sequence, which makes the training process more stable and effectively avoids the problem of gradient disappearance or gradient explosion. And residual connection is used after TMSA and MLP, and the features processed by TMSA and MLP are superimposed with the features before processing to avoid the degradation problem of matrix weights in the network. The calculation process is as follows:

    Znl=TMSA(LN(Znl1))+Znl1 (2)
    Znl=MLP(LN(Znl))+Znl. (3)

    In the formula, Znl1 is the output of the nth window in the lth layer, TMSA contains two multi-head attention modules (MSA), as shown in Fig. 3. First, the first MSA performs self-attention calculation on each row, keeps the feature blocks of different rows independent, and aggregates the context information between feature blocks on the horizontal scale. Then, the second MSA performs self-attention calculation for each column, keeps the feature blocks of different columns independent, and aggregates the context information between feature blocks on the vertical scale. Finally, the outputs of the two MSA are concatenated to form a global receptive field, covering the crowd feature information of horizontal and vertical dimensions. The calculation process is as follows:

    TMSA(Znl1)=[MSA1(Znl1); MSA2(Znl1)]W, WRD×D. (4)

    MSA contains m self-attention (SA) modules. In each independent SA, input sequence Znl1, calculate the query (Q), key (K) and value (V) of the sequence, where the process is as follows:

    [Q,K,V]=Znl1WQ,K,V, WQ,K,VRD×Dm (5)
    SA(Znl1)=softmax(QKTD)V. (6)

    In the formula, WQ,K,V are learnable matrices, and the outputs of m self-attention modules are connected in series, which can be expressed as

    MSA(Znl1)=[SA1(Znl1); SA2(Znl1);  ; SA12(Znl1)]WWRD×D. (7)

    MLP contains two linear layers with the Gaussian error linear unit (GELU) activation function. This paper uses the GELU activation function of a standard normal distribution, as shown in (8)

    GELU(x)=0.5x(1+tanh[2π(x+0.44715x3)]). (8)

    The first linear layer expands the dimension of the feature sequence from D to 4D, and the second linear layer shrinks the dimension of the feature sequence from 4D to D.

    In order to improve the convergence speed and feature fitting ability of the weakly-supervised crowd counting method during training, we propose a linear feature calibration structure. To achieve feature calibration and transfer between Parent-Net and Child-Net, we consider that the feature parameters of Parent-Net and Child-Net belong to the same linear space Vn (n represents the number of channels of features). Each channel feature in the Child-Net can be transferred from the corresponding channel feature in the Parent-Net by a linear transformation. Fig. 4 shows how the Child-Net feature’s parameters are transferred from the Parent-Net by a linear calibration.

    Figure  4.  The process of the linear feature calibration

    In Fig. 4, we define the channel features in Parent-Net as FPRh×w×n (h,w,n represent the length, width, and number of channels of the features, respectively), the feature transfer factors as αR1×1×n, and the feature bias weights as β R1×1×n, so the process of linear feature correction can be expressed as

    FC=[FP1×α1+β1,,FPn×αn+βn] =[[f111f11wf1h1f1hw]×α1+β1, ,[fn11fn1wfnh1fnhw]×αn+βn]. (9)

    In the formula, fihwFP(in). The advantage of using linear feature calibration to train the network is that Child-Net inherits the crowd features in Parent-Net well, and retains an extremely strong generalization ability, which continuously improving the calibration of crowd features through transfer factors and bias weights, improving the feature fitting ability of the network. Meanwhile, since Parent-Net and Child-Net have the same backbone network, and the features in Child-Net are transferred through the features in Parent-Net, the parameters learned by the two parts of the network are different. Taking a simple CNN model as an example, assuming that there are L layers of convolution, where the size of each convolutional kernel is K × K, and the number of output channels is fixed to N. Then, the number of Parent-Net parameters is N × K × K × L, while the number of Parent-Net parameters is N × 2 × L, because Child-Net only needs to learn the transfer factor and bias weights, so the number of Parent-Net parameters is only 2/(K × K) of Parent-Net parameters, which is only 2/9 when the size of convolutional kernel is 3 × 3. Therefore, the increase of the number of parameters is within an acceptable range.

    In order to further strengthen the method proposed in this paper, we make full use of the correlation between the local and global crowd feature information to train the network, and improve the accuracy of crowd density estimation. The comprehensive loss function is designed, which consists of LC loss function and L2 loss function, as shown in (10)

    Loss(θ)=Lc(θ)+(1)L2(θ). (10)

    In the formula, LC is the counting loss of the PC-Net estimated number of people with the ground truth, and L2 is the MSE loss between PC-Net predicted density map and parent-net predicted density map, where, the LC counting loss can be expressed as

    LC(θ)=1NNi=1|FY(Xi,θ)YiYi|2. (11)

    In the formula, N denotes the number of images in the training set, FY (Xi, θ) denotes the estimated number of people obtained from the Xi ( i = 1,,N) images, and θ denotes a set of parameters that can be learned; Yi denotes the true number of people in the Xi (i = 1,,N) images. L2 loss can be expressed as

    L2(θ)=12NNi=1Z(Xi,θ)ZP(Xi,θ)22. (12)

    In the formula, N denotes the number of images in the training set, Xi represents the ith image of the input, θ denotes a set of parameters that can be learned, and Z(Xi ,θ) denotes the prediction result of PC-Net and ZP (Xi ,θ) denotes the prediction result of Parent-Net.

    The crowd features extracted by PC-Net contains the location information of each pedestrian. We use a focal inverse distance transform (FIDT) to process the features to generate a visualized crowd density map [67]. The specific process can be expressed as follows: if there are Z pedestrian feature points in an image, the following processing is performed on the feature images:

    P(x,y)=min(x,y)Z(xx)2+(yy)2 (13)
    I=1P(x,y)(AP(x,y)+B)+C. (14)

    In (13), Z denotes the set of all crowd feature points, and for any feature point (x, y), the Euclidean distance P(x, y) is calculated with its nearest feature point (x,y). Since the distance between feature points varies greatly, it is difficult to perform distance regression directly, so the inverse function is used for regression, as shown in (14), where I is the processing result of FIDT, C is an additional constant, usually set to 1, to avoid division by 0 in the calculation process, and P(x, y) is exponentially processed to slow down the decay of the crowd head information, and I is visually displayed to generate a visual crowd density map. Finally, the predicted crowd density values are obtained by 2D integrating and summing the generated density maps. In the experiments, A = 0.02, B = 0.75 were set.

    In the training phase, one iteration updates parameters for two models. As shown in Fig. 1, first, the data are fed into Parent-Net for training, and the global feature FP is optimized using the gradient descent method, as follows:

    FP=FPε×LC(θ). (15)

    In the formula, εdenotes the learning rate of Parent-Net, and LC is the count loss of the Parent-Net estimated number of crowd with Ground Truth. Second, we use the Linear Feature Calibration structure to transfer FP channel-by-channel into Child-Net to obtain FC, the process of transfer, as shown in (9). Since the transfer factor α and the bias weight β used in linear feature calibration need to be learned by Child-Net, we need to feed the local image data into Child-Net and optimize FC with the gradient descent method, as follows:

    FC=FCμ×Loss(θ). (16)

    In the formula, μdenotes the learning rate of Child-Net. Loos is the value of the integrated loss function designed in this paper. In the testing phase, we use the best-performing model on the test set to make an inference.

    During training we use the Adam optimizer, Batch_size is set to 16, the learning rate εin the Parent-Net and μ in the Child-Net are initialized as 0.0001, reduced by 0.5 times after every 50 epochs, where the GELU function is used as an activation function to improve the training speed and effectively avoid the disappearance and explosion of the gradient. We use l2 regularization of 0.0001 to avoid over-fitting. Since the images in the dataset have different resolutions, the resolution of all images is adjusted to 768 × 768. The experimental environment is shown in Table I.

    Table  I.  Experimental Environment (Table I Introduces the Experimental Environment Parameters From the Aspects of System, Frame, Language, CPU, GPU and RAM)
    NameParameter
    SystemWindows 11
    FramePytorch
    LanguagePython
    CPUIntel (R) Core (TM) i7-10870H CPU @ 2.50GHz
    GPUNVIDIA GEFORCE GTX 3060
    RAM16.00 GB
     | Show Table
    DownLoad: CSV

    In this work, extensive experiments are conducted on five crowd datasets of ShanghaiTech Part A, ShanghaiTech Part B, UCF_CC_50, UCF_QNRF and JHU-CROWD++. Unlike fully-supervised methods, only count-level labels are used as supervision information in the training process. Choose a representative crowd image on each dataset, as shown in Fig. 5. The crowd images in each dataset have different degrees of uneven crowd scale variation.

    Figure  5.  Crowd images from five crowd datasets. (a) From the ShanghaiTech Part A dataset; (b) From the ShanghaiTech Part B dataset; (c) From the UCF_CC_50 dataset; (d) From the UCF_QNRF dataset; (e) JHU-CROWD++ dataset.

    1) ShanghaiTech [3]: It has 1198 crowd images with a total of 330165 people. The dataset contains two parts, A and B. Part A includes 482 highly crowded crowd images, of which 300 form the training dataset and the remaining 182 form the testing dataset; Part B includes 716 relatively sparse crowd images, of which 400 images form the training dataset, and the remaining 316 images form the testing dataset.

    2) UCF_CC_50 [68]: It has 50 crowd images, these images have different resolutions and different viewing angles. The number of pedestrians per crowd image varies from 94 to 4543, with an average of 1280 pedestrians per image. Due to the limited number of images in this dataset and the large span of the number of people in the image, five-fold cross-validation is used in this dataset.

    3) UCF_QNRF [69]: It has 1535 crowd images with a total of 12 500 people, of which 1201 form the training sample set and the remaining 334 form the test sample set. The number of pedestrians per crowd image varies from 49 to 12 865, with an average of 815 pedestrians per image.

    4) JHU-CROWD++ [70]: It is an unconstrained dataset with 4372 images that are collected under various weather-based conditions such as rain, snow, etc. and contains 2722 training images, 500 validation images, and 1600 testing images. This dataset contains 1.5 million annotations at both image level and head-level. The total number of people in each image ranges from 0 to 25 791.

    In this paper, we use mean absolute error (MAE), mean squared error (MSE), and mean absolute percentage error (MAPE) as evaluation metrics for PC-Net performance. MAE is the average absolute value of the difference between the target and estimated densities, and it is the average L1 loss between the target and estimated densities. It can highlight outliers in the data, and its value is not affected by the influence of outliers, making it more robust in evaluating algorithm performance. MSE is the average squared value of the difference between the target density and the estimated density, and it is the average L2 loss between the target density and the estimated density, which can penalize larger error values. MSE usually magnifies the effect of squared error to make it easier to distinguish between models with larger error values. MAPE is a measure of the relative error between the estimated and actual values, which makes it easier to compare the variability of algorithms on different datasets, and it uses the percentage error to measure the prediction error, which is more convenient in practice, more intuitive, easy to explain. MAPE can avoid the problem of “mean squared error inflation” that tends to occur in MSE, i.e., when there are outlier values in the dataset, as the impact on MAPE is smaller. In summary, the three metrics MAE, MSE, and MAPE are chosen to evaluate the algorithm in this paper, which can well demonstrate the robustness as well as the accuracy of PC-Net. The calculation is shown as follows:

    MAE=1NNi=1|ˆCiCi| (17)
    MSE=1NNi=1(ˆCiCi)2 (18)
    MAPE=100%NNi=1|ˆCiCiCi|. (19)

    In the formula, N represents the number of test images, Ci represents the actual number of people in the ith image, and ˆCi represents the estimated number of people in the ith image. When the values of MAE, MSE and MAPE are smaller, the error between the estimated number of people and the actual number of people is smaller, indicating that the effect of the experiment is better.

    The ShanghaiTech dataset is a crowded and multi-scale dataset, to verify the counting performance of PC-Net. Experiments are performed on this dataset and compared with state-of-the-art methods, and the results of MAE, MSE and MAPE are given in Table II. The UCF_CC_50 dataset includes 50 grayscale images, where the images have different resolutions and viewing angles, which is a very challenging dataset with various crowd scenes and a limited total number of images; Therefore, five-fold cross-validation is performed to maximize the use of samples, and the dataset is randomly divided into 5 equal parts. Each part contains 10 images, four of which are used as the training dataset, and the remaining one is used as the testing dataset, where a total of five trainings and testings are performed. Finally the average value of the error index is taken as the final experimental result, and compared with state-of-the-art methods. The results of MAE, MSE and MAPE are given in Table II. UCF_QNRF dataset is also a crowded and multi-scale dataset, which is collected from three different datasets and includes various scenes around the world. The total number of images and the total number of people far exceed the first three datasets, and compared with state-of-the-art methods, the results of MAE, MSE and MAPE are given in Table II. JUU-CROWD++ is a super large dataset, which contains crowd images under various complex weather conditions. Compared with state-of-the-art methods, the results of MAE, MSE and MAPE are given in Table II.

    Table  II.  Comparison of PC-Net and the State-of-the-Art Methods on the Shanghaitech, UCF_CC_50, UCF-QNRF and JHU_CROWD++ Datasets. L Denotes the Training Label Contains Location Information, and C Denotes the Training Label Contains Population Number Information. Red and Blue Indicate the First and the Second-Best Performances, Respectively
    MethodVenueLabelPart APart BUCF_CC_50UCF_QNRFJHU_CROWD++
    L/CMAE/MSE/MAPEMAE/MSE/MAPEMAE/MSE/MAPEMAE/MSE/MAPEMAE/MSE/MAPE
    MCNN [3]CVPR16+/+110.2/173.2/28.2%26.4/41.3/27.1%377.6/509.1/35.9%277.0/426.0/32.5%160.6/377.7/24.4%
    CSRNet [8]CVPR18+/+68.2/115.0/15.8%10.6/16.0/9.3%266.1/397.5/26.3%−/−/−72.2/249.9/26.4%
    CFF [71]ICCV19+/+65.2/109.4/14.9%7.2/12.2/6.1%−/−/−93.8 /146.5/13.1%−/−/−
    TEDnet [12]CVPR19+/+64.2/109.1/14.7%8.2/12.8/7.1%249.4/354.5/24.2%113.0/188.0/16.1%−/−/−
    PCC-Net [72]TCSVT19+/+73.5/124.0/17.2%11.0/19.0/9.7%240.0/315.5/23.1%148.7/247.3/22.3%−/−/−
    RPNet [73]CVPR20+/+61.2/96.9/13.9%8.1/11.6/7.0%−/−/−−/−/−−/−/−
    ASNet [74]CVPR20+/+57.8/90.1/13.0%−/−/−174.8/251.6/15.8%91.5/159.7/12.6%−/−/−
    AMRNet [75]ECCV20+/+61.5/98.3/13.9%7.0/11.0/6.0%184.0/256.8/16.8%86.6/152.2/11.9%−/−/−
    DM-Count [76]NeurIPS20+/+59.7/95.7/13.5%7.4/11.8/6.3%211.0/291.5/19.6%85.6/148.3/11.7%−/−/−
    GL [77]CVPR21+/+61.3/95.4/13.9%7.3/11.7/6.3%−/−/−84.3/147.5/11.5%59.9/259.5/20.1%
    SFCN [78]IJCV21+/+64.8/107.5/14.9%7.6/13.0/6.5%214.2/318.2/20.1%102.0/171.4/14.3%62.9/247.5/22.2%
    LW-Count [79]TCSVT22+/+69.7/100.5/16.2%10.1/12.4/8.9%239.3/307.6/23.1%149.7/238.4/22.5%90.2/311.8/35.2%
    SSR-HEF [80]TII22+/+55.0/88.3/12.3%6.1/9.5/5.2%173.3/260.4/15.7%70.2/128.6/9.4%51.3/101.6/17.4%
    ST-Net [81]TMM22+/+52.9/83.6/11.2%6.3/10.3/5.3%162.0/230.4/14.5%87.9/166.4/12.9%−/−/−
    MFFNet [82]TIM23+/+107.3/188.5/27.3%12.7/35.2/11.4%323.5/482.8/33.9%142.1/271.1/21.1%−/−/−
    CTASNet [83]TCSVT23+/+54.3/87.8/12.2%6.5/10.7/5.5%158.1/221.9/14.1%80.9/139.2/11.0%−/−/−
    Scale-Aware [84]CEE23+/+58.6/98.5/13.2%7.5/8.5/6.5%210.2/260.8/19.7%−/−/−−/−/−
    L2R [26]TPMAI19−/+73.6/112.0/17.2%13.7/21.4/12.4%279.6/408.1/27.9%124.0/196.0/17.9%−/−/−
    Yang et al. [39]ECCV20−/+104.6/145.2/26.4%12.3/21.2/11.0%−/−/−−/−/−−/−/−
    MATT [33]PR21−/+80.1/129.4/19.0%11.7/17.5/10.4%355.0/550.2/38.2%−/−/−−/−/−
    SUA [34]ICCV21−/+68.5/125.6/16.4%12.3/17.9/11.1%−/−/−119.2/213.3/17.1%−/−/−
    TransCrowd [21]SCIS22−/+66.1/105.1/15.2%9.3/16.1/8.1%−/−/−97.2/168.5/13.4%56.8/193.6/19.6%
    PC-Net (Ours)−/+58.7/89.5/13.3%7.3/10.4/6.3%217.3/309.7/20.5%84.8/148.9/11.6%52.2/103.9/17.8%
     | Show Table
    DownLoad: CSV

    1) Performance on the ShanghaiTech Dataset: In this paper, PC-Net is compared with state-of-the-art methods, and the results are show shown in Table II, where we divide these methods into two groups. The first group is the fully-supervised methods, which uses location information and population number information as supervised information. The second group is the weakly-supervised methods, which uses only population number information as supervised information. According to Table II, PC-Net is very competitive with the first group. Although MAE, MSE, and MAPE do not achieve the optimal results, they are more advantageous than most of the fully-supervised methods such as GL, LW-Count, etc., PC-Net largely closes the gap in counting performance between weakly-supervised methods and fully-supervised methods, and its labeling cost is much lower than that of fully-supervised methods. The advantage of PC-Net over the second group is more obvious, as MAE, MSE and MAPE are better than the existing weakly-supervised methods. On Part A, MAE, MSE and MAPE are improved by 11.2%, 14.8% and 12.5%, respectively, and on Part B, MAE, MSE and MAPE are improved by 21.5%, 35.4% and 22.2%, respectively. Thus, it is demonstrated that PC-Net can achieve the best density estimation performance with a weakly-supervised training mode by training with feature linear correction. Figs. 6(a) and 6(b) shows some visualization results of PC-Net on Part A and Part B datasets.

    Figure  6.  Visualization results of the density maps on (a) ShanghaiTech Part A and (b) ShanghaiTech Part B, respectively.

    It can be seen that PC-Net performs well on two datasets, generating accurately distributed density maps with high resolution, and the prediction results are close to the true values. Comparing Figs. 6(a) and 6(b), the ShanghaiTech Part A dataset is extremely crowded and has little change in crowd scale, while the ShanghaiTech Part B dataset is relatively sparse but has large change in crowd scale, which indicates that PC-Net can be a good fit for different degrees of crowd scale changes. The third column of Fig. 6, gives the heat map of the Parent-Net output, and we use the red box to mark out the obvious misidentification or omission of identification. It can be seen that extracting the crowd features using only Parent-Net can easily produce misidentification of crowd features. The process of crowd feature correction and transfer, on the other hand, corrects the location information of the crowd well, which further compensates for the lack of crowd location information under the weakly-supervised crowd counting method and further improves the accuracy of the crowd counting.

    2) Performance on the UCF_CC_50 Dataset: According to Table II, under the weakly-supervised training, compared to the second group, PC-Net outperforms other weakly-supervised methods on the UCF_CC_50 dataset, with MAE, MSE and MAPE improving by 38.8%, 43.7% and 46.3%, respectively, which proves the superiority of PC-Net. However, compared with the first group, PC-Net has obvious shortcomings, probably because the data in this dataset is limited and the number of people included in the images spans a relatively large range. The prediction results are not stable enough, and there are a small number of images with large errors, which leads to a decrease in the performance of the method. Fig. 7 shows some visualization results of PC-Net on UCF_CC_50 dataset.

    Figure  7.  Visualization results of the density maps on UCF_CC_50.

    In the second column of Fig. 7, the crowd density map generated by PC-Net is given, it can be seen that PC-Net can make good predictions and generate accurate density maps in crowded scenarios with variable scales, and the generated density maps have different sparsity for different scales of crowds, but the estimated values have some errors relative to the real values, such as the first set of images, which are a small number of images with large errors in the test of this paper. It is possible that the low brightness of the image is affecting the counting performance of the network. To further evaluate the visualized crowd density images, we manually label several samples containing crowd locations and perform a visual display of crowd locations, as shown in the third column of Fig. 7. A new set of evaluation metrics, structural similarity (SSIM) and peak signal-to-noise ratio (PSNR), were also used to evaluate the generated crowd density maps with labeled density maps, which compensate for the shortcomings of the one-dimensional evaluation metrics such as MAE and MSE. The experimental results show that PC-Net can fit the location information of the crowd well, and although there are some location errors, they are within the acceptable range. To summarize, PC-Net’s counting performance is slightly insufficient in the face of extremely crowded crowds, so more data is needed for training to improve the accuracy of the model on extremely crowded datasets.

    3) Performance on the UCF_QNRF Dataset: According to Table II, compared with the second group of methods, in the weakly-supervised mode, the MAE, MSE and MAPE of PC-Net improved by 12.8%, 11.6% and 13.4%, respectively, which indicates a significant improvement in the prediction effect. PC-Net achieved optimal counting accuracy on this dataset and showed excellent robustness. Compared with the first group of methods, PC-Net also outperforms some of the fully-supervised training methods, such as L2R and TEDnet, etc., further narrowing the gap in counting performance between weakly-supervised training methods and fully-supervised training methods, and comparing some of the most advanced crowd density estimation methods, PC-Net greatly reduces the injection cost of the dataset label, although its performance is slightly worse. Fig. 8 shows some visualization results of PC-Net on the UCF_QNRF dataset.

    Figure  8.  Visualization results of the density maps on UCF_QNRF.

    It can be seen that PC-Net has a good ability to fit the crowd of different scales in the first image of Fig. 8, and generates an accurate and high resolution density map, which reflects that PC-Net has a good ability to solve the problem of drastic changes in the scale of the crowd. PC-Net also generates an accurate density map for the denser crowd in the second image, but there is a certain error in the estimated value relative to the real value, which is a small number of images with large errors in the test of this paper’s method, probably because the difference in lighting interferes with the counting accuracy, and more training is needed in the next step to improve the robustness of the model and exclude large errors.

    4) Performance on the JHU-CROWD++ Dataset: According to Table II, PC-Net has a great advantage over both the first and second group of methods, and it is superior to the weakly-supervised methods, such as the advanced method TransCrowd. In addition, compared with fully-supervised methods, such as MCNN and CSRNet, the counting accuracy of PC-Net has been significantly improved on this dataset, and MAE, MSE and MAPE all achieved the second best performance, which proves the effectiveness of our method. Fig. 9 shows some visualization results of PC-Net on JHU-CROWD++ dataset, including the plots of crowd density in rainy and snowy days. It can be seen that PC-Net can better process the crowd images under the deteriorating weather conditions.

    Figure  9.  Visualization results of the density maps on JHU-CROWD++.

    In order to test the performance of PC-Net in practical applications, we conducted experiments in several real scenarios. To ensure the applicability and universality of the experiments, images taken by cameras on campuses, subway stations and city roads were randomly selected as test set, The test set contains a total of 400 images with more than 10 scenes, each containing a number of people ranging from 0 to 2000, all with a resolution of 768 × 768, and these data generally have uneven scales, background noise and other common factors that affect the accuracy of crowd density estimation. We conducted multiple groups of experiments and took the average value as the result of the test, and the experimental results are shown in Table III. Fig. 10 shows some visualization results of actual experiment.

    Table  III.  Comparison of PC-Net and the Other Methods on the Random Dataset
    MethodVenueLabelMAEMSEMAPE
    L/C
    MCNN [3]CVPR16+/+102.3157.424.5%
    CSRNet [8]CVPR18+/+59.890.2112.3%
    LW-Count [79]TCSVT22+/+61.388.713.4%
    TransCrowd [21]SCIS22−/+57.489.412.8%
    PC-Net (Ours)−/+49.775.310.6%
     | Show Table
    DownLoad: CSV
    Figure  10.  Visualization results of the density maps of the actual experiment.

    It can be seen that the test results of PC-Net on the unfamiliar dataset still outperformed the compared algorithms, and the MAE, MSE, and MAPE all obtained the optimal results. Here we randomly selected the visualization results of four scenes, and we can see that PC-Net has some adaptability to scenes that have never been seen before, and can also generate accurate and high-resolution crowd density maps, and the predicted crowd density is within an acceptable error range compared with the real crowd density. However, the results of the multi-scene test reveal the problem where the migration of PC-Net for multiple scenes is slightly insufficient, such as the third and fourth group of images. The error of the crowd density in this scene is obviously slightly larger, and the main problem is the poor adaptability of PC-Net for this scene. Therefore, PC-Net needs to increase the training sample and test in multiple scenes to adjust its model parameters and also increase its adaptability to multiple scenes.

    In the training process of the network, the selection of the initial training hyper-parameter is crucial to the success of the network training. Setting good parameters can help avoid gradient disappearance or gradient explosion during the network training process, and make the neural network learn the features of the data more quickly and accurately, and improve the training effect and generalization ability of the model. In order to determine the optimal initialization parameters, we discussed the effects of different Batch_size, learning rate, activation function and optimizer on the performance of PC-Net in ShanghaiTech Part A. The experimental results are shown in Fig. 11.

    Figure  11.  Visualization results of the study of different initialization hyper-parameter settings. (a) Denotes the MAE values for different Batch_size; (b) Denotes the MAE values for different Learning rate; (c) Denotes the MAE values for different Activation function; (d) Denotes the MAE values for different Optimizer.

    It can be seen that PC-Net is more sensitive to Batch_size and learning rate during the training process. As the Batch_size increases, the parallel performance of GPU is fully utilized, thus speeding up the training of the model. A larger Batch_size requires more memory storage, and a larger Batch_size may lead to overfitting because the model is more likely to memorize a larger Batch_size and thus fail to learn the overall features of the input data; therefore, on balance, we set the Batch_size to 16. Due to the complexity of the crowd density estimation task and the depth of PC-Net layers, we consider setting a smaller initial learning rate in order to avoid unstable or scattered training. The experimental results show that optimal model performance is achieved when the initial learning rate is set to 0.0001. For the activation function and the optimizer, the experimental results show that PC-Net is less sensitive to them. We compared five activation functions (GELU, Sigmoid, ReLU, Tanh, Softmax) and three optimizers (SGD, Adam, Momentum). The experimental results show that PC-Net achieves optimal results when GELU is used as the activation function and Adam is used as the optimizer. In summary, we set the Batch_size to 16, set the initial learning rate to 0.0001, and use GELU as the activation function and Adam optimizer at the beginning of the training.

    With CNN-based deep learning, because CNNs have a small receptive field, this limits the upper limit of the global feature extraction range of the network. Therefore, CNN-based methods are more capable of extracting local crowd information in small intervals, but are not enough for global crowd information extraction of the whole image, which makes it difficult for CNN-based methods to establish global context features. However, ViT has the advantage of capturing long context dependencies and a global receptive domain, which is a good remedy for this deficiency of CNN. We calculated effective receptive fields for both VGG network and ViT. Specifically, we measure the effective receptive field of different layers as the absolute value of the gradient of the center location of the feature map with respect to the input. Results are averaged across all channels in each map for 16 randomly selected images, with results in Fig. 12.

    Figure  12.  Visualization results of the effective receptive fields for VGG and ViT

    We observe that lower layer effective receptive fields for ViT are indeed larger than in VGG, and while VGG effective receptive fields grow gradually, ViT receptive fields become much more global midway through the network. ViT receptive fields also show strong dependence on their center patch due to their strong residual connections. Overall, VGG effective receptive fields are highly local and grow gradually, ViT effective receptive fields shift from local to global. To further verify the superiority of the performance of pyramid vision transformer, we conducted an ablation study using the first 10 layers of VGG16 replacing pyramid vision transformer as the backbone network of PC-Net, keeping the other structures the same; the results are shown in Table IV.

    Table  IV.  Results of Backbone Network Ablation Study
    MethodPart APart BUCF_CC_50UCF_QNRFJHU_CROWD++
    MAE/MSE/MAPEMAE/MSE/MAPEMAE/MSE/MAPEMAE/MSE/MAPEMAE/MSE/MAPE
    PC-Net (VGG)62.2/91.5./14.2%9.5/14.3/8.3%243.2/343.2/24.1%98.4/167.3/13.7%68.4/141.2/24.6%
    PC-Net (Ours)58.7/89.5/13.3%7.3/10.4/6.3%217.3/309.7/20.5%84.8/148.9/11.6%52.2/103.9/17.8%
     | Show Table
    DownLoad: CSV

    As can be seen, the performance of the pyramid vision transformer is significantly better than that of VGG. On the Part A dataset, MAE, MSE and MAPE are improved by 5.6%, 2.2% and 6.3%, respectively. On the Part B dataset, MAE, MSE and MAPE are improved by 23.2%, 27.3% and 24.1%, respectively. On UCF_CC_50 dataset, MAE, MSE and MAPE are improved by 10.6%, 9.8% and 14.9%, respectively. On UCF_QNRF dataset, MAE, MSE and MAPE are improved by 13.8%, 11.0% and 15.3%, respectively. On the JHU-CROWD++ dataset MAE, MSE and MAPE are improved by 23.7%, 26.4% and 27.6%, respectively. This is further proof of the superiority of PC-Net’s performance.

    The pyramid vision transformer structure proposed in this paper consists of three layers of ViT; to verify its rationality, ablation experiments were conducted on five datasets, keeping the other structures the same in the experiments to test the performance of the pyramid vision transformer under different configurations. The results are shown in Table V, where L* represents the number of layers of ViT in pyramid vision transformer.

    Table  V.  Results of Pyramid Vision Transformer Ablation Study
    MethodPart APart BUCF_CC_50UCF_QNRFJHU_CROWD++
    MAE/MSE/MAPEMAE/MSE/MAPEMAE/MSE/MAPEMAE/MSE/MAPEMAE/MSE/MAPE
    L1105.3/187.4/26.6%13.5/39.4/12.2%331.3/491.2/35.0%141.5/261.1/21.0%107.9/369.8/45.3%
    L1+L265.1/114.2/14.9%8.9/14.3/7.7%257.3/363.3/25.2%104.1/171.2/14.6%71.2/175.9/25.9%
    L1+L2+L3 (Ours)58.7/89.5/13.3%7.3/10.4/6.3%217.3/309.7/20.5%84.8/148.9/11.6%52.2/103.9/17.8%
    L1+L2+L3+L458.6/89.9/13.3%7.2/10.5/6.2%218.2/308.3/20.6%85.1/148.5/11.7%51.3/102.3/17.9%
    L1+L2+L3+L4+L560.1/98.3/13.6%8.3/14.5/7.2%245.4/312.5/23.7%102.3/141.4/14.4%61.3/165.4/21.5%
     | Show Table
    DownLoad: CSV

    As can be seen, the performance of PC-Net improves as the first three layers of ViT are stacked in the pyramid vision transformer, but when the ViT is stacked to the 4th layer, the performance of the model is almost the same as the 3-layer ViT, and even some metrics appear to decrease; when the number of layers of ViT continues to increase to the 5th layer, the performance of the model starts to decrease rapidly. We believe that as the depth of the network increases, the gradients in the backpropagation may become very small, leading to the gradient vanishing problem, or the gradients become very large, leading to the gradient exploding problem. These problems can make the training process difficult and make convergence impossible. Moreover, as the depth of the network increases, the number of parameters in the network increases exponentially, which can over-fit the network and make it unable to generalize to new datasets, reducing the generalization ability of the network. Therefore, we take the above factors into consideration and set the number of layers of ViT in pyramid vision transformer as 3.

    In this paper, we propose a new training method using a linear feature calibration to train the network through incremental learning, which utilizes the correlation between global and local image features. To verify its effectiveness, we tested the convergence speed of the network under different supervision methods on the ShanghaiTech dataset, and the results are shown in Fig. 13.

    Figure  13.  Convergence speed of networks under different supervision methods. The abscissa is the training Epochs, and the ordinate is the loss value during training. The three training methods sample the same backbone network, which is the backbone network proposed in this paper.

    Here, the “weakly-supervised” training method means that instead of using the linear feature calibration structure proposed in this paper, a channel attention fusion approach is used, and the features extracted from the Parent-Net and Child-Net are weighted and fused. It can be seen that the convergence speed and the fitting ability of our proposed the training method are clearly better than those of the “weakly-supervised” training method. However, it can be seen that, compared with the fully-supervised method, the convergence stability of PC-Net is poor during the training process. The reason is that during the training process, there is uncertainty in the sample labels, which increases the learning difficulty of the model, and the model may be affected by noise and learn the wrong features, resulting in overfitting or under fitting, causing the model to converge unstably. We believe that we can try to use a nonlinear feature correction process to increase the stability of the training process.

    The loss function is very important in the training process of the network, and using different loss functions will have a great impact on the performance of the model regression, therefore, a comprehensive loss function is designed and the weight of L2 and LC is adjusted by loss weights. To obtain the optimal loss function, experiments are conducted on the ShanghaiTech and UCF_QNRF datasets, and the values of is discussed. The results are shown in Fig. 14.

    Figure  14.  MAE and MSE in ShanghaiTech Part A and UCF_QNRF datasets under different counting loss weights.

    As can be seen, different weight loss functions have an impact on the performance of the network model, and MAE and MSE change with , showing a trend of decreasing and then increasing, which proves the rationality of the two-part loss function. The optimal values of MAE and MSE were obtained at =0.6, which proved the improvement of the comprehensive loss function on the network performance.

    To analyze the parameter complexity and time complexity of PC-Net, we compared MAE, Params, and inference time on the ShanghaiTech dataset, and the experimental results are shown in Table VI.

    Table  VI.  VI Comparison of the Params, MAE and Running Time of PC-Net and Other Methods on the ShanghaiTech Dataset
    MethodLableParams (M)MAEGPU (MS)CPU (S)
    CSRNet [8]+/+16.2668.285.524. 3
    BL [38]+/+21.5061.563.725.8
    DUBNet [85]+/+18.0564.4414.851.3
    SFCN [78]+/+38.6064.881.924.1
    DKPNet [86]+/+30.6355.689.423.7
    ST-Net [81]+/+15.5652.961.321.4
    PC-Net (Ours)−/+36.858.775.422.6
     | Show Table
    DownLoad: CSV

    As can be seen, the advantage of PC-Net is that it uses a weakly-supervised training method, which reduces the training cost; the MAE as well as the density estimation performance is good, however, the number of parameters is slightly larger and the required inference time is longer. Therefore, the performance of PC-Net suffers and the density estimation accuracy decreases when applied to devices with limited computational resources, such as embedded devices. Therefore, in future work, we consider studying a lightweight method based on PC-Net to analyze the parameter bottleneck layer in PC-Net, find the part of the network that consumes the most time and computational resources, and compress it to improve the training and application of the network.

    In this paper, an effective weakly-supervised crowd density estimation method is proposed and a novel training method is used to achieve an optimal balance between training costs and counting performance. The network mainly consists of a pair of parent-child networks and a linear feature calibration structure. Specifically, the parent network is used to extract the crowd features, the child network is used to extract the feature correction parameters and bias weights, and the features are calibrated using the linear feature calibration structure to improve the convergence speed as well as the fitting ability of the network. In addition, a pyramid vision transformer is used as the backbone network of the PC-Net to solve the problem of uneven scale in the crowd, while the spatial correlation and crowd sensitivity of density map are enhanced by global-local feature loss and counting loss.

    In future work, we will study a crowd counting and positioning method based on PC-Net, which can not only achieve a better personal positioning function and counting accuracy, but also the number of parameters is smaller and more stable during training.

  • [1]
    E. Walach and L. Wolf, “Learning to count with CNN boosting,” in Proc. 14th European Conf. Computer Vision, Amsterdam, The Netherlands, 2016, pp. 660–676.
    [2]
    C. Wang, H. Zhang, L. Yang, S. Liu, and X. Cao, “Deep people counting in extremely dense crowds,” in Proc. 23rd ACM Int. Conf. Multimedia, Brisbane, Australia, 2015, pp. 1299–130.
    [3]
    Y. Zhang, D. Zhou, S. Chen, S. Gao, and Y. Ma, “Single-image crowd counting via multi-column convolutional neural network,” in Proc. IEEE Conf. Computer Vision and Pattern Recognition, Las Vegas, USA, 2016, pp. 589–597.
    [4]
    V. Sindagi and V. Patel, “Multi-level bottom-top and top-bottom feature fusion for crowd counting,” in Proc. IEEE/CVF Int. Conf. Computer Vision, Seoul, Korea (South), 2019, pp. 1002–1012.
    [5]
    Y. Wang, S. Hu, G. Wang, C. Chen, and Z. Pan, “Multi-scale dilated convolution of convolutional neural network for crowd counting,” Multimed. Tools Appl., vol. 79, no. 1–2, pp. 1057–1073, Jan. 2020. doi: 10.1007/s11042-019-08208-6
    [6]
    V. A. Sindagi and V. M. Patel, “Generating high-quality crowd density maps using contextual pyramid CNNs,” in Proc. IEEE Int. Conf. Computer Vision, Venice, Italy, 2017, pp. 1879–1888.
    [7]
    D. Guo, K. Li, Z.-J. Zha, and M. Wang, “DADNet: Dilated-attention-deformable ConvNet for crowd counting,” in Proc. 27th ACM Int. Conf. Multimedia, Nice, France, 2019, pp. 1823–1832.
    [8]
    Y. Li, X. Zhang, and D. Chen, “CSRNet: Dilated convolutional neural networks for understanding the highly congested scenes,” in Proc. IEEE/CVF Conf. Computer Vision and Pattern Recognition, Salt Lake City, USA, 2018, pp. 1091–1100.
    [9]
    X. Cao, Z. Wang, Y. Zhao, and F. Su, “Scale aggregation network for accurate and efficient crowd counting,” in Proc. 15th European Conf. Computer Vision, Munich, Germany, 2018, pp. 757–773.
    [10]
    X. Chen, Y. Bin, N. Sang, and C. Gao, “Scale pyramid network for crowd counting,” in Proc. IEEE Winter Conf. Applications Computer Vision, Waikoloa, USA, 2019, pp. 1941–1950.
    [11]
    L. Huang, S. Shen, L. Zhu, Q. Shi, and J. Zhang, “Context-aware multi-scale aggregation network for congested crowd counting,” Sensors, vol. 22, no. 9, p. 3233, Apr. 2022. doi: 10.3390/s22093233
    [12]
    X. Jiang, Z. Xiao, B. Zhang, X. Zhen, X. Cao, D. Doermann, and L. Shao, “Crowd counting and density estimation by trellis encoder-decoder networks,” in Proc. IEEE/CVF Conf. Computer Vision and Pattern Recognition, Long Beach, USA, 2019, pp. 6126–6135.
    [13]
    Y.-C. Li, R.-S. Jia, Y.-X. Hu, D.-N. Han, and H.-M. Sun, “Crowd density estimation based on multi scale features fusion network with reverse attention mechanism,” Appl. Intell., vol. 52, no. 11, pp. 13097–13113, Sept. 2022. doi: 10.1007/s10489-022-03187-y
    [14]
    N. Liu, Y. Long, C. Zou, Q. Niu, L. Pan, and H. Wu, “ADCrowdNet: An attention-injective deformable convolutional network for crowd understanding,” in Proc. IEEE/CVF Conf. Computer Vision and Pattern Recognition, Long Beach, USA, 2019, pp. 3220–3229.
    [15]
    A. Zhang, L. Yue, J. Shen, F. Zhu, X. Zhen, X. Cao, and L. Shao, “Attentional neural fields for crowd counting,” in Proc. IEEE/CVF Int. Conf. Computer Vision, Seoul, Korea (South), 2019, pp. 5713–5722.
    [16]
    H. Chu, J. Tang, and H. Hu, “Attention guided feature pyramid network for crowd counting,” J. Vis. Commun. Image Represent., vol. 80, p. 103319, Oct. 2021. doi: 10.1016/j.jvcir.2021.103319
    [17]
    T. Lei, D. Zhang, R. Wang, S. Li, W. Zhang, and A. K. Nandi, “MFP-Net: Multi-scale feature pyramid network for crowd counting,” IET Image Process., vol. 15, no. 14, pp. 3522–3533, Dec. 2021. doi: 10.1049/ipr2.12230
    [18]
    S. Amirgholipour, W. Jia, L. Liu, X. Fan, D. Wang, and X. He, “PDANet: Pyramid density-aware attention based network for accurate crowd counting,” Neurocomputing, vol. 451, pp. 215–230, Sept. 2021. doi: 10.1016/j.neucom.2021.04.037
    [19]
    A. Dosovitskiy, L. Beyer, A. Kolesnikov, D. Weissenborn, X. Zhai, T. Unterthiner, M. Dehghani, M. Minderer, G. Heigold, S. Gelly, J. Uszkoreit, and N. Houlsby, “An image is worth 16 × 16 words: Transformers for image recognition at scale,” in Proc. 9th Int. Conf. Learning Representations, 2021.
    [20]
    S. Yang, W. Guo, and Y. Ren, “CrowdFormer: An overlap patching vision transformer for top-down crowd counting,” in Proc. 31st Int. Joint Conf. Artificial Intelligence, Vienna, Austria, 2022, pp. 1545–1551.
    [21]
    D. Liang, X. Chen, W. Xu, Y. Zhou, and X. Bai, “Transcrowd: Weakly-supervised crowd counting with transformers,” Sci. China Inf. Sci., vol. 65, no. 6, p. 160104, Apr. 2022. doi: 10.1007/s11432-021-3445-y
    [22]
    W. Wang, E. Xie, X. Li, D.-P. Fan, K. Song, D. Liang, T. Lu, P. Luo, and L. Shao, “Pyramid vision transformer: A versatile backbone for dense prediction without convolutions,” in Proc. IEEE/CVF Int. Conf. Computer Vision, Montreal, Canada, 2021, pp. 548–558.
    [23]
    U. Sajid, X. Chen, H. Sajid, T. Kim, and G. Wang, “Audio-visual transformer based crowd counting,” in Proc. IEEE/CVF Int. Conf. Computer Vision, Montreal, Canada, 2021, pp. 2249–2259.
    [24]
    G. Sun, Y. Liu, T. Probst, D. P. Paudel, N. Popovic, and L. Van Gool, “Boosting crowd counting with transformers,” arXiv preprint arXiv: 2105.10926, 2021.
    [25]
    P. T. Do, “Attention in crowd counting using the transformer and density map to improve counting result,” in Proc. 8th NAFOSTED Conf. Information and Computer Science, Hanoi, Vietnam, 2021, pp. 65–70.
    [26]
    X. Liu, J. van de Weijer, and A. D. Bagdanov, “Exploiting unlabeled data in CNNs by self-supervised learning to rank,” IEEE Trans. Pattern Anal. Mach. Intell., vol. 41, no. 8, pp. 1862–1878, Aug. 2019. doi: 10.1109/TPAMI.2019.2899857
    [27]
    Q. Wang, J. Gao, W. Lin, and Y. Yuan, “Learning from synthetic data for crowd counting in the wild,” in Proc. IEEE/CVF Conf. Computer Vision and Pattern Recognition, Long Beach, USA, 2019, pp. 8190–8199.
    [28]
    G. Olmschenk, J. Chen, H. Tang, and Z. Zhu, “Dense crowd counting convolutional neural networks with minimal data using semi-supervised dual-goal generative adversarial networks,” in Proc. IEEE Conf. Computer Vision and Pattern Recognition: Learning with Imperfect Data Workshop, 2019, pp. 21–28.
    [29]
    D. B. Sam, A. Agarwalla, J. Joseph, V. A. Sindagi, R. V. Babu, and V. M. Patel, “Completely self-supervised crowd counting via distribution matching,” in Proc. 17th European Conf. Computer Vision, Tel Aviv, Israel, 2022, pp. 186–204.
    [30]
    Z. Zhao, M. Shi, X. Zhao, and L. Li, “Active crowd counting with limited supervision,” in Proc. 16th European Conf. Computer Vision, Glasgow, UK, 2020, pp. 565–581.
    [31]
    Y. Liu, L. Liu, P. Wang, P. Zhang, and Y. Lei, “Semi-supervised crowd counting via self-training on surrogate tasks,” in Proc. 16th European Conf. Computer Vision, Glasgow, UK, 2020, pp. 242–259.
    [32]
    V. A. Sindagi, R. Yasarla, D. S. Babu, R. V. Babu, and V. M. Patel, “Learning to count in the crowd from limited labeled data,” in Proc. 16th European Conf. Computer Vision, Glasgow, UK, 2020, pp. 212–229.
    [33]
    Y. Lei, Y. Liu, P. Zhang, and L. Liu, “Towards using count-level weak supervision for crowd counting,” Pattern Recognit., vol. 109, p. 107616, Jan. 2021. doi: 10.1016/j.patcog.2020.107616
    [34]
    Y. Meng, H. Zhang, Y. Zhao, X. Yang, X. Qian, X. Huang, and Y. Zheng, “Spatial uncertainty-aware semi-supervised crowd counting,” in Proc. IEEE/CVF Int. Conf. Computer Vision, Montreal, Canada, 2021, pp. 15529–15539.
    [35]
    S. Khaki, H. Pham, Y. Han, A. Kuhl, W. Kent, and L. Wang, “DeepCorn: A semi-supervised deep learning method for high-throughput image-based corn kernel counting and yield estimation,” Knowl. Based Syst., vol. 218, p. 106874, Apr. 2021. doi: 10.1016/j.knosys.2021.106874
    [36]
    D. B. Sam, N. N. Sajjan, H. Maurya, and R. V. Babu, “Almost unsupervised learning for dense crowd counting,” in Proc. 33rd AAAI Conf. Artificial Intelligence, Honolulu, USA, 2019, pp. 8868–8875.
    [37]
    M. von Borstel, M. Kandemir, P. Schmidt, M. K. Rao, K. Rajamani, and F. A. Hamprecht, “Gaussian process density counting from weak supervision,” in Proc. 14th European Conf. Computer Vision, Amsterdam, The Netherlands, 2016, pp. 365–380.
    [38]
    Z. Ma, X. Wei, X. Hong, and Y. Gong, “Bayesian loss for crowd count estimation with point supervision,” in Proc. IEEE/CVF Int. Conf. Computer Vision, Seoul, Korea (South), 2019, pp. 6141–6150.
    [39]
    Y. Yang, G. Li, Z. Wu, L. Su, Q. Huang, and N. Sebe, “Weakly-supervised crowd counting learns from sorting rather than locations,” in Proc. 16th European Conf. Computer Vision, Glasgow, UK, 2020, pp. 1–17.
    [40]
    A. B. Chan, Z.-S. J. Liang, and N. Vasconcelos, “Privacy preserving crowd monitoring: Counting people without people models or tracking,” in Proc. IEEE Conf. Computer Vision and Pattern Recognition, Anchorage, USA, 2008, 1–7.
    [41]
    B. Guo, Z. Wang, Z. Yu, Y. Wang, N. Y. Yen, R. Huang, and X. Zhou, “Mobile crowd sensing and computing: The review of an emerging human-powered sensing paradigm,” ACM Comput. Surv., vol. 48, no. 1, p. 7, Aug. 2015.
    [42]
    X. Sheng, J. Tang, X. Xiao, and G. Xue, “Leveraging GPS-less sensing scheduling for green mobile crowd sensing,” IEEE Internet Things J., vol. 1, no. 4, pp. 328–336, Aug. 2014. doi: 10.1109/JIOT.2014.2334271
    [43]
    C. Liu, X. Wen, and Y. Mu, “Recurrent attentive zooming for joint crowd counting and precise localization,” in Proc. IEEE/CVF Conf. Computer Vision and Pattern Recognition, Long Beach, USA, 2019, pp. 1217–1226.
    [44]
    Z.-Q. Cheng, J.-X. Li, Q. Dai, X. Wu, and A. Hauptmann, “Learning spatial awareness to improve crowd counting,” in Proc. IEEE/CVF Int. Conf. Computer Vision, Seoul, Korea (South), 2019, pp. 6151–6160.
    [45]
    V. S. Lempitsky and A. Zisserman, “Learning to count objects in images,” in Proc. 23rd Int. Conf. Neural Information Processing Systems, Vancouver, Canada, 2010, pp. 1324–1332.
    [46]
    L. Wen, D. Du, P. Zhu, Q. Hu, Q. Wang, L. Bo, and S. Lyu, “Drone-based joint density map estimation, localization and tracking with space-time multi-scale attention network,” arXiv preprint arXiv: 1912.01811, 2019.
    [47]
    Z. Zhuang, H. Tao, Y. Chen, V. Stojanovic, and W. Paszke, “An optimal iterative learning control approach for linear systems with nonuniform trial lengths under input constraints,” IEEE Trans. Syst. Man Cybern. Syst., vol. 53, no. 6, pp. 3461–3473, Jun. 2023. doi: 10.1109/TSMC.2022.3225381
    [48]
    X. Xin, Y. Tu, V. Stojanovic, H. Wang, K. Shi, S. He, and T. Pan, “Online reinforcement learning multiplayer non-zero sum games of continuous-time Markov jump linear systems,” Appl. Math. Comput., vol. 412, p. 126537, Jan. 2022.
    [49]
    C. Zhou, H. Tao, Y. Chen, V. Stojanovic, and W. Paszke, “Robust point-to-point iterative learning control for constrained systems: A minimum energy approach,” Int. J. Robust Nonlinear Control, vol. 32, no. 18, pp. 10139–10161, Dec. 2022. doi: 10.1002/rnc.6354
    [50]
    X. Song, N. Wu, S. Song, and V. Stojanovic, “Switching-like event-triggered state estimation for reaction–Diffusion neural networks against DoS attacks,” Neural Process. Lett., vol. 55, no. 7, pp. 8997–9018, Dec. 2023. doi: 10.1007/s11063-023-11189-1
    [51]
    W. Li, X. Luo, H. Yuan, and M. C. Zhou, “A momentum-accelerated Hessian-vector-based latent factor analysis model,” IEEE Trans. Serv. Comput., vol. 16, no. 2, pp. 830–844, Mar.–Apr. 2023. doi: 10.1109/TSC.2022.3177316
    [52]
    D. Wu, X. Luo, Y. He, and M. C. Zhou, “A prediction-sampling-based multilayer-structured latent factor model for accurate representation to high-dimensional and sparse data,” IEEE Trans. Neural Netw. Learn. Syst., 2022. DOI: 10.1109/TNNLS.2022.3200009
    [53]
    X. Luo, Y. Zhou, Z. Liu, L. Hu, and M. C. Zhou, “Generalized Nesterov’s acceleration-incorporated, non-negative and adaptive latent factor analysis,” IEEE Trans. Serv. Comput., vol. 15, no. 5, pp. 2809–2823, Sep.–Oct. 2022. doi: 10.1109/TSC.2021.3069108
    [54]
    D. Wu and X. Luo, “Robust latent factor analysis for precise representation of high-dimensional and sparse data,” IEEE/CAA J. Autom. Sinica, vol. 8, no. 4, pp. 796–805, Apr. 2021. doi: 10.1109/JAS.2020.1003533
    [55]
    W. Zhao, M. Wang, Y. Liu, H. Lu, C. Xu, and L. Yao, “Generalizable crowd counting via diverse context style learning,” IEEE Trans. Circuits Syst. Video Technol., vol. 32, no. 8, pp. 5399–5410, Aug. 2022. doi: 10.1109/TCSVT.2022.3146459
    [56]
    F. Zhu, H. Yan, X. Chen, and T. Li, “Real-time crowd counting via lightweight scale-aware network,” Neurocomputing, vol. 472, pp. 54–67, Feb. 2022. doi: 10.1016/j.neucom.2021.11.099
    [57]
    J. T. Zhou, L. Zhang, J. Du, X. Peng, Z. Fang, Z. Xiao, and H. Zhu, “Locality-aware crowd counting,” IEEE Trans. Pattern Anal. Mach. Intell., vol. 44, no. 7, pp. 3602–3613, Jul. 2022.
    [58]
    C. Xu, D. Liang, Y. Xu, S. Bai, W. Zhan, X. Bai, and M. Tomizuka, “Autoscale: Learning to scale for crowd counting,” Int. J. Comput. Vis., vol. 130, no. 2, pp. 405–434, Feb. 2022. doi: 10.1007/s11263-021-01542-z
    [59]
    J. Zhang, “Knowledge learning with crowdsourcing: A brief review and systematic perspective,” IEEE/CAA J. Autom. Sinica, vol. 9, no. 5, pp. 749–762, May 2022. doi: 10.1109/JAS.2022.105434
    [60]
    Z. Liu, N. Wu, Y. Qiao, and Z. Li, “Performance evaluation of public bus transportation by using DEA models and Shannon’s entropy: An example from a company in a large city of China,” IEEE/CAA J. Autom. Sinica, vol. 8, no. 4, pp. 779–795, Apr. 2021. doi: 10.1109/JAS.2020.1003405
    [61]
    Y. Zheng, Q. Li, C. Wang, X. Wang, and L. Hu, “Multi-source adaptive selection and fusion for pedestrian dead reckoning,” IEEE/CAA J. Autom. Sinica, vol. 9, no. 12, pp. 2174–2185, Dec. 2022. doi: 10.1109/JAS.2021.1004144
    [62]
    X. Deng, S. Chen, Y. Chen, and J.-F. Xu, “Multi-level convolutional transformer with adaptive ranking for semi-supervised crowd counting,” in Proc. 4th Int. Conf. Algorithms, Computing and Artificial Intelligence, Sanya, China, 2021, p. 2.
    [63]
    Y. Fang, B. Zhan, W. Cai, S. Gao, and B. Hu, “Locality-constrained spatial transformer network for video crowd counting,” in Proc. IEEE Int. Conf. Multimedia and Expo, Shanghai, China, 2019, pp. 814–819.
    [64]
    Y. Fang, S. Gao, J. Li, W. Luo, L. He, and B. Hu, “Multi-level feature fusion based locality-constrained spatial transformer network for video crowd counting,” Neurocomputing, vol. 392, pp. 98–107, Jun. 2020. doi: 10.1016/j.neucom.2020.01.087
    [65]
    Z. Wu, L. Liu, Y. Zhang, M. Mao, L. Lin, and G. Li, “Multimodal crowd counting with mutual attention transformers,” in Proc. IEEE Int. Conf. Multimedia and Expo, Taipei, China, 2022, pp. 1–6.
    [66]
    Q. Wang, T. Han, J. Gao, and Y. Yuan, “Neuron linear transformation: Modeling the domain shift for crowd counting,” IEEE Trans. Neural Netw. Learn. Syst., vol. 33, no. 8, pp. 3238–3250, Aug. 2022. doi: 10.1109/TNNLS.2021.3051371
    [67]
    D. Liang, W. Xu, Y. Zhu, and Zhou, Y, “Focal inverse distance transform maps for crowd localization,” IEEE Trans. Multimedia, vol. 25, pp. 6040–6052, 2023. doi: 10.1109/TMM.2022.3203870
    [68]
    H. Idrees, I. Saleemi, C. Seibert, and M. Shah, “Multi-source multi-scale counting in extremely dense crowd images,” in Proc. IEEE Conf. Computer Vision and Pattern Recognition, Portland, USA, 2013, pp. 2547–2554.
    [69]
    H. Idrees, M. Tayyab, K. Athrey, D. Zhang, S. Al-Maadeed, N. Rajpoot, and M. Shah, “Composition loss for counting, density map estimation and localization in dense crowds,” in Proc. 15th European Conf. Computer Vision, Munich, Germany, 2018, pp. 544–559.
    [70]
    V. A. Sindagi, R. Yasarla, and V. M. Patel, “JHU-CROWD++: Large-scale crowd counting dataset and a benchmark method,” IEEE Trans. Pattern Anal. Mach. Intell., vol. 44, no. 5, pp. 2594–2609, May 2022.
    [71]
    Z. Shi, P. Mettes, and C. Snoek, “Counting with focus for free,” in Proc. IEEE/CVF Int. Conf. Computer Vision, Seoul, Korea (South), 2019, pp. 4199–4208.
    [72]
    J. Gao, Q. Wang, and X. Li, “PCC Net: Perspective crowd counting via spatial convolutional network,” IEEE Trans. Circuits Syst. Video Technol., vol. 30, no. 10, pp. 3486–3498, Oct. 2020. doi: 10.1109/TCSVT.2019.2919139
    [73]
    Y. Yang, G. Li, Z. Wu, L. Su, Q. Huang, and N. Sebe, “Reverse perspective network for perspective-aware object counting,” in Proc. IEEE/CVF Conf. Computer Vision and Pattern Recognition, Seattle, USA, 2020, pp. 4373–4382.
    [74]
    X. Jiang, L. Zhang, M. Xu, T. Zhang, P. Lv, B. Zhou, X. Yang, and Y. Pang, “Attention scaling for crowd counting,” in Proc. IEEE/CVF Conf. Computer Vision and Pattern Recognition, Seattle, USA, 2020, pp. 4705–4714.
    [75]
    X. Liu, J. Yang, W. Ding, T. Wang, Z. Wang, and J. Xiong, “Adaptive mixture regression network with local counting map for crowd counting,” in Proc. 16th European Conf. Computer Vision, Glasgow, UK, 2020, pp. 241–257.
    [76]
    B. Wang, H. Liu, D. Samaras, and M. Hoai, “Distribution matching for crowd counting,” in Proc. 34th Int. Conf. Neural Information Processing Systems, Vancouver, Canada, 2020, p. 135.
    [77]
    J. Wan, Z. Liu, and A. B. Chan, “A generalized loss function for crowd counting and localization,” in Proc. IEEE/CVF Conf. Computer Vision and Pattern Recognition, Nashville, USA, 2021, pp. 1974–1983.
    [78]
    Q. Wang, J. Gao, W. Lin, and Y. Yuan, “Pixel-wise crowd understanding via synthetic data,” Int. J. Comput. Vis., vol. 129, no. 1, pp. 225–245, Jan. 2021. doi: 10.1007/s11263-020-01365-4
    [79]
    Y. Liu, G. Cao, H. Shi, and Y. Hu, “LW-count: An effective lightweight encoding-decoding crowd counting network,” IEEE Trans. Circuits Syst. Video Technol., vol. 32, no. 10, pp. 6821–6834, Oct. 2022. doi: 10.1109/TCSVT.2022.3171235
    [80]
    J. Chen, K. Wang, W. Su, and Z. Wang, “SSR-HEF: Crowd counting with multiscale semantic refining and hard example focusing,” IEEE Trans. Industr. Inform., vol. 18, no. 10, pp. 6547–6557, Oct. 2022. doi: 10.1109/TII.2022.3160634
    [81]
    M. Wang, H. Cai, X.-F. Han, J. Zhou, and M. Gong, “STNet: Scale tree network with multi-level auxiliator for crowd counting,” IEEE Trans. Multimedia, vol. 25, pp. 2074–2084, 2023. doi: 10.1109/TMM.2022.3142398
    [82]
    X. Zhang, L. Han, W. Shan, X. Wang, S. Chen, C. Zhu, and B. Li, “A multi-scale feature fusion network with cascaded supervision for cross-scene crowd counting,” IEEE Trans. Instrum. Meas., vol. 72, p. 5007515, Feb. 2023.
    [83]
    Y. Chen, J. Yang, B. Chen, and S. Du, “Counting varying density crowds through density guided adaptive selection CNN and transformer estimation,” IEEE Trans. Circuits Syst. Video Technol., vol. 33, no. 3, pp. 1055–1068, Mar. 2023. doi: 10.1109/TCSVT.2022.3208714
    [84]
    V. K. Sharma, R. N. Mir, and C. Singh, “Scale-aware CNN for crowd density estimation and crowd behavior analysis,” Comput. Electr. Eng., vol. 106, p. 108569, Mar. 2023. doi: 10.1016/j.compeleceng.2022.108569
    [85]
    M.-H. Oh, P. Olsen, and K. N. Ramamurthy, “Crowd counting with decomposed uncertainty,” in Proc. 34th AAAI Conf. Artificial Intelligence, New York, USA, 2020, pp. 11799–11806.
    [86]
    B. Chen, Z. Yan, K. Li, P. Li, B. Wang, W. Zuo, and L. Zhang, “Variational attention: Propagating domain-specific knowledge for multi-domain learning in crowd counting,” in Proc. IEEE/CVF Int. Conf. Computer Vision, Montreal, Canada, 2021, pp. 16045–16055.
  • Related Articles

    [1]Yiming Gao, Shi Qiu, Ming Liu, Lixian Zhang, Xibin Cao. Fault Warning of Satellite Momentum Wheels With a Lightweight Transformer Improved by FastDTW[J]. IEEE/CAA Journal of Automatica Sinica, 2025, 12(3): 539-549. doi: 10.1109/JAS.2024.124689
    [2]Jing Zhou, Jun Shang, Tongwen Chen. Cybersecurity Landscape on Remote State Estimation: A Comprehensive Review[J]. IEEE/CAA Journal of Automatica Sinica, 2024, 11(4): 851-865. doi: 10.1109/JAS.2024.124257
    [3]Shengao Lu, Tong Wu, Lixian Zhang, Jianan Yang, Ye Liang. Interpolated Bumpless Transfer Control for Asynchronously Switched Linear Systems[J]. IEEE/CAA Journal of Automatica Sinica, 2024, 11(7): 1579-1590. doi: 10.1109/JAS.2023.124155
    [4]Honghao Zhu, MengChu Zhou, Yu Xie, Aiiad Albeshri. A Self-Adapting and Efficient Dandelion Algorithm and Its Application to Feature Selection for Credit Card Fraud Detection[J]. IEEE/CAA Journal of Automatica Sinica, 2024, 11(2): 377-390. doi: 10.1109/JAS.2023.124008
    [5]Meng Wang, Jiawan Zhang, Jiayi Ma, Xiaojie Guo. Cas-FNE: Cascaded Face Normal Estimation[J]. IEEE/CAA Journal of Automatica Sinica, 2024, 11(12): 2423-2434. doi: 10.1109/JAS.2024.124899
    [6]Pan Huang, Xin Luo. FDTs: A Feature Disentangled Transformer for Interpretable Squamous Cell Carcinoma Grading[J]. IEEE/CAA Journal of Automatica Sinica.
    [7]Yahui Liu, Bin Tian, Yisheng Lv, Lingxi Li, Fei-Yue Wang. Point Cloud Classification Using Content-Based Transformer via Clustering in Feature Space[J]. IEEE/CAA Journal of Automatica Sinica, 2024, 11(1): 231-239. doi: 10.1109/JAS.2023.123432
    [8]Yanzheng Zhu, Nuo Xu, Fen Wu, Xinkai Chen, Donghua Zhou. Fault Estimation for a Class of  Markov Jump Piecewise-Affine Systems: Current Feedback Based Iterative Learning Approach[J]. IEEE/CAA Journal of Automatica Sinica, 2024, 11(2): 418-429. doi: 10.1109/JAS.2023.123990
    [9]Zhiming Zhang, Zhenyu Lei, Masaaki Omura, Hideyuki Hasegawa, Shangce Gao. Dendritic Learning-Incorporated Vision Transformer for Image Recognition[J]. IEEE/CAA Journal of Automatica Sinica, 2024, 11(2): 539-541. doi: 10.1109/JAS.2023.123978
    [10]Xiang Li, Shupeng Yu, Yaguo Lei, Naipeng Li, Bin Yang. Dynamic Vision-Based Machinery Fault Diagnosis With Cross-Modality Feature Alignment[J]. IEEE/CAA Journal of Automatica Sinica, 2024, 11(10): 2068-2081. doi: 10.1109/JAS.2024.124470
    [11]Cong Pan, Junran Peng, Zhaoxiang Zhang. Depth-Guided Vision Transformer With Normalizing Flows for Monocular 3D Object Detection[J]. IEEE/CAA Journal of Automatica Sinica, 2024, 11(3): 673-689. doi: 10.1109/JAS.2023.123660
    [12]Zefeng Zheng, Luyao Teng, Wei Zhang, Naiqi Wu, Shaohua Teng. Knowledge Transfer Learning via Dual Density Sampling for Resource-Limited Domain Adaptation[J]. IEEE/CAA Journal of Automatica Sinica, 2023, 10(12): 2269-2291. doi: 10.1109/JAS.2023.123342
    [13]Jiayi Ma, Linfeng Tang, Fan Fan, Jun Huang, Xiaoguang Mei, Yong Ma. SwinFusion: Cross-domain Long-range Learning for General Image Fusion via Swin Transformer[J]. IEEE/CAA Journal of Automatica Sinica, 2022, 9(7): 1200-1217. doi: 10.1109/JAS.2022.105686
    [14]Shasha Mei, Yong Ma, Xiaoguang Mei, Jun Huang, Fan Fan. S2-Net: Self-Supervision Guided Feature Representation Learning for Cross-Modality Images[J]. IEEE/CAA Journal of Automatica Sinica, 2022, 9(10): 1883-1885. doi: 10.1109/JAS.2022.105884
    [15]Jia Sun, Peng Wang, Zhengke Qin, Hong Qiao. Effective Self-calibration for Camera Parameters and Hand-eye Geometry Based on Two Feature Points Motions[J]. IEEE/CAA Journal of Automatica Sinica, 2017, 4(2): 370-380. doi: 10.1109/JAS.2017.7510556
    [16]Yan Ma, Xiuwen Zhou, Bingsi Li, Hong Chen. Fractional Modeling and SOC Estimation of Lithium-ion Battery[J]. IEEE/CAA Journal of Automatica Sinica, 2016, 3(3): 281-287.
    [17]Kecai Cao, YangQuan Chen, Dan Stuart, Dong Yue. Cyber-physical Modeling and Control of Crowd of Pedestrians: A Review and New Framework[J]. IEEE/CAA Journal of Automatica Sinica, 2015, 2(3): 334-344.
    [18]Cunxiao Miao, Jingjing Li. Autonomous Landing of Small Unmanned Aerial Rotorcraft Based on Monocular Vision in GPS-denied Area[J]. IEEE/CAA Journal of Automatica Sinica, 2015, 2(1): 109-114.
    [19]Sen Wang, Ling Chen, Dongbing Gu, Huosheng Hu. Cooperative Localization of AUVs Using Moving Horizon Estimation[J]. IEEE/CAA Journal of Automatica Sinica, 2014, 1(1): 68-76.
    [20]Xisheng Dai, Senping Tian, Yunjian Peng, Wenguang Luo. Closed-loop P-type Iterative Learning Control of Uncertain Linear Distributed Parameter Systems[J]. IEEE/CAA Journal of Automatica Sinica, 2014, 1(3): 267-273.

Catalog

    通讯作者: 陈斌, bchen63@163.com
    • 1. 

      沈阳化工大学材料科学与工程学院 沈阳 110142

    1. 本站搜索
    2. 百度学术搜索
    3. 万方数据库搜索
    4. CNKI搜索

    Figures(14)  / Tables(6)

    Article Metrics

    Article views (422) PDF downloads(55) Cited by()

    Highlights

    • A weakly-supervised crowd density estimation method is proposed
    • A novel and effective training approach for incremental learning is used
    • A characteristic linear calibration is designed to improve the weakly-supervised
    • The influence of hyper-parameters and losses on model performance is discussed

    /

    DownLoad:  Full-Size Img  PowerPoint
    Return
    Return